
The Risk & Resilience Metrics Facility
The Baseline for a Sustainable Future.
There is a persistent gap between understanding the economic and social implications of disaster risk and taking decisions to invest in disaster resilience.
The Risk & Resilience Metrics Facility is a coalition of private and public sector collaborators led by the United Nations Disaster Risk Reduction organization (UNDRR) committed to delivering enhanced analytics to help close this gap.
It translates complex disaster risk data and evidence of resilience benefits into clear, actionable insights, and delivers analytics that empower decision-makers to understand and manage current and future risk. Better analytics can inform smarter investment decisions and reduce disaster losses, safeguarding development gains, and building a safer, more resilient future.
Looking at the past is not enough to prepare for the risks of the future
Disaster losses vary from year to year, and that volatility can make it harder to plan. Probabilistic risk models can help overcome this challenge. They look at both the past and the future by simulating thousands of possible scenarios to help governments anticipate impacts before they occur.
They provide insights into average annual losses (AAL) but also probable maximum losses (PML) in terms of the likely return period, such as 1-in-100 event. In short, they look beyond annual fluctuations to assess impact and offer a way to see financial stakes of future disasters more clearly before the worst happens.
Currently, over 95% of losses from recorded economic disasters are due to one of the “big five” hazards: earthquakes, floods, storms, droughts and extreme heat
At the core of the Facility is the commitment to develop a consistent, global set of probabilistic hazard risk models for these five costliest hazards, as well as for tsunamis, landslides and the increasing impacts of wildfire.
This means initially focusing on technical collaborations to develop the first global models for drought related crop loss, wildfire and extreme heat, and making sure that globally consistent models for all 8 hazards are available by 2028. (Facility collaborators expect to release their first global probabilistic drought-crop loss model in November 2026).
The Metrics
The consortium members are collaborating to provide analytics for 19 risk metrics and 19 complementary resilience metrics that look across social, economic, and environmental domains. In collaboration with leading technical experts from across the globe, the Facility aims to make high-quality data available for each of the metrics outlined below by the end of 2028.
Some metrics, such as recovery speed of the poorest households is well developed and already available at a globally consistent scale. These are being incorporated into a global visualiser for immediate use and many have already been included in the sample country notes.
Others, such as an AAL/PML for agricultural crops have been applied in some regions but need technical work to make them scalable at global level. For example, thanks to collaboration between UNDRR and Facility partner organisations, a global crop loss AAL/PML is being modelled and will be available within 2026.
A smaller number of metrics, such as life years lost, or metrics for multi-hazard impacts, have been successfully tested and applied in specific studies, but require more methodological work to be globally scalable. For each of these, work is beginning with expert groups to further define and co-create scalable datasets that can be taken to scale.
Focusing on this priority set of metrics can help lay the foundations for common risk language and signpost the path from risk to resilience. The aim is not to replace downscaled national analytics but instead to help create a more clear, consistent foundation that empowers countries to show why the actions they are taking to prevent disasters matter.
For more information on the datasets, assumptions and modelling approaches used in the profiles, see the Risk and Resilience Metrics methodology.
Combined the global probabilistic hazard, risk and resilience metrics lay the foundations for common risk language that helps signpost the path from risk to resilience. The aim is not to replace downscaled national analytics but instead to help create a more clear, consistent foundation that empowers countries to show why the actions they are taking to prevent disasters matter.
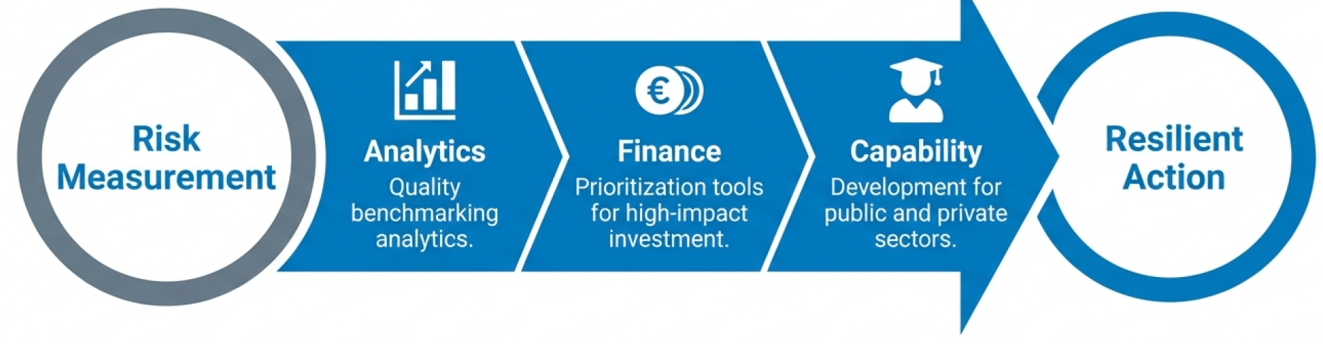
Analytics developed by the facility aim to supports decision-makers to move from measuring risk to reducing future losses and actively building resilience through four steps:
1. Understand you hazard profile

Point to where disasters are most likely to occur, and how severe their impacts could be, using probabilistic methods scaled for global coverage.
2. Link to economic and social exposure
Spotlights who and what is exposed — and what more frequent and intense disasters could mean for societies, economies, and supply chains.
3. Prioritize current and future investment

Looks at where resources are being deployed and how financial tools and policies can strengthen resilience — focusing action where it makes the greatest difference.
4. Consider potential resilience options

Provides insights on policy and investment options, helping decision makers chart their pathway from risk to resilience — accounting for how risk may change in the future.
Learn more about Investment activities for adaptation and Resilience (in development)
Who the platform serves
The Risk to Resilience platform supports a wide range of decision-makers who need clear, credible information.
Governments can use it to prioritize public investment, strengthen fiscal stability and support sustainable development.
Financial institutions, investors and rating agencies can better understand how disaster risk affects economic stability and long-term investment performance.
Development partners can align financing around shared resilience priorities.
Communities can identify where risks are concentrated and where action can have the greatest impact.
The Tools
1. The Global Risk and Resilience Map Viewer
The Map Viewer is UNDRR's global platform for exploring disaster risk and resilience data in one place.
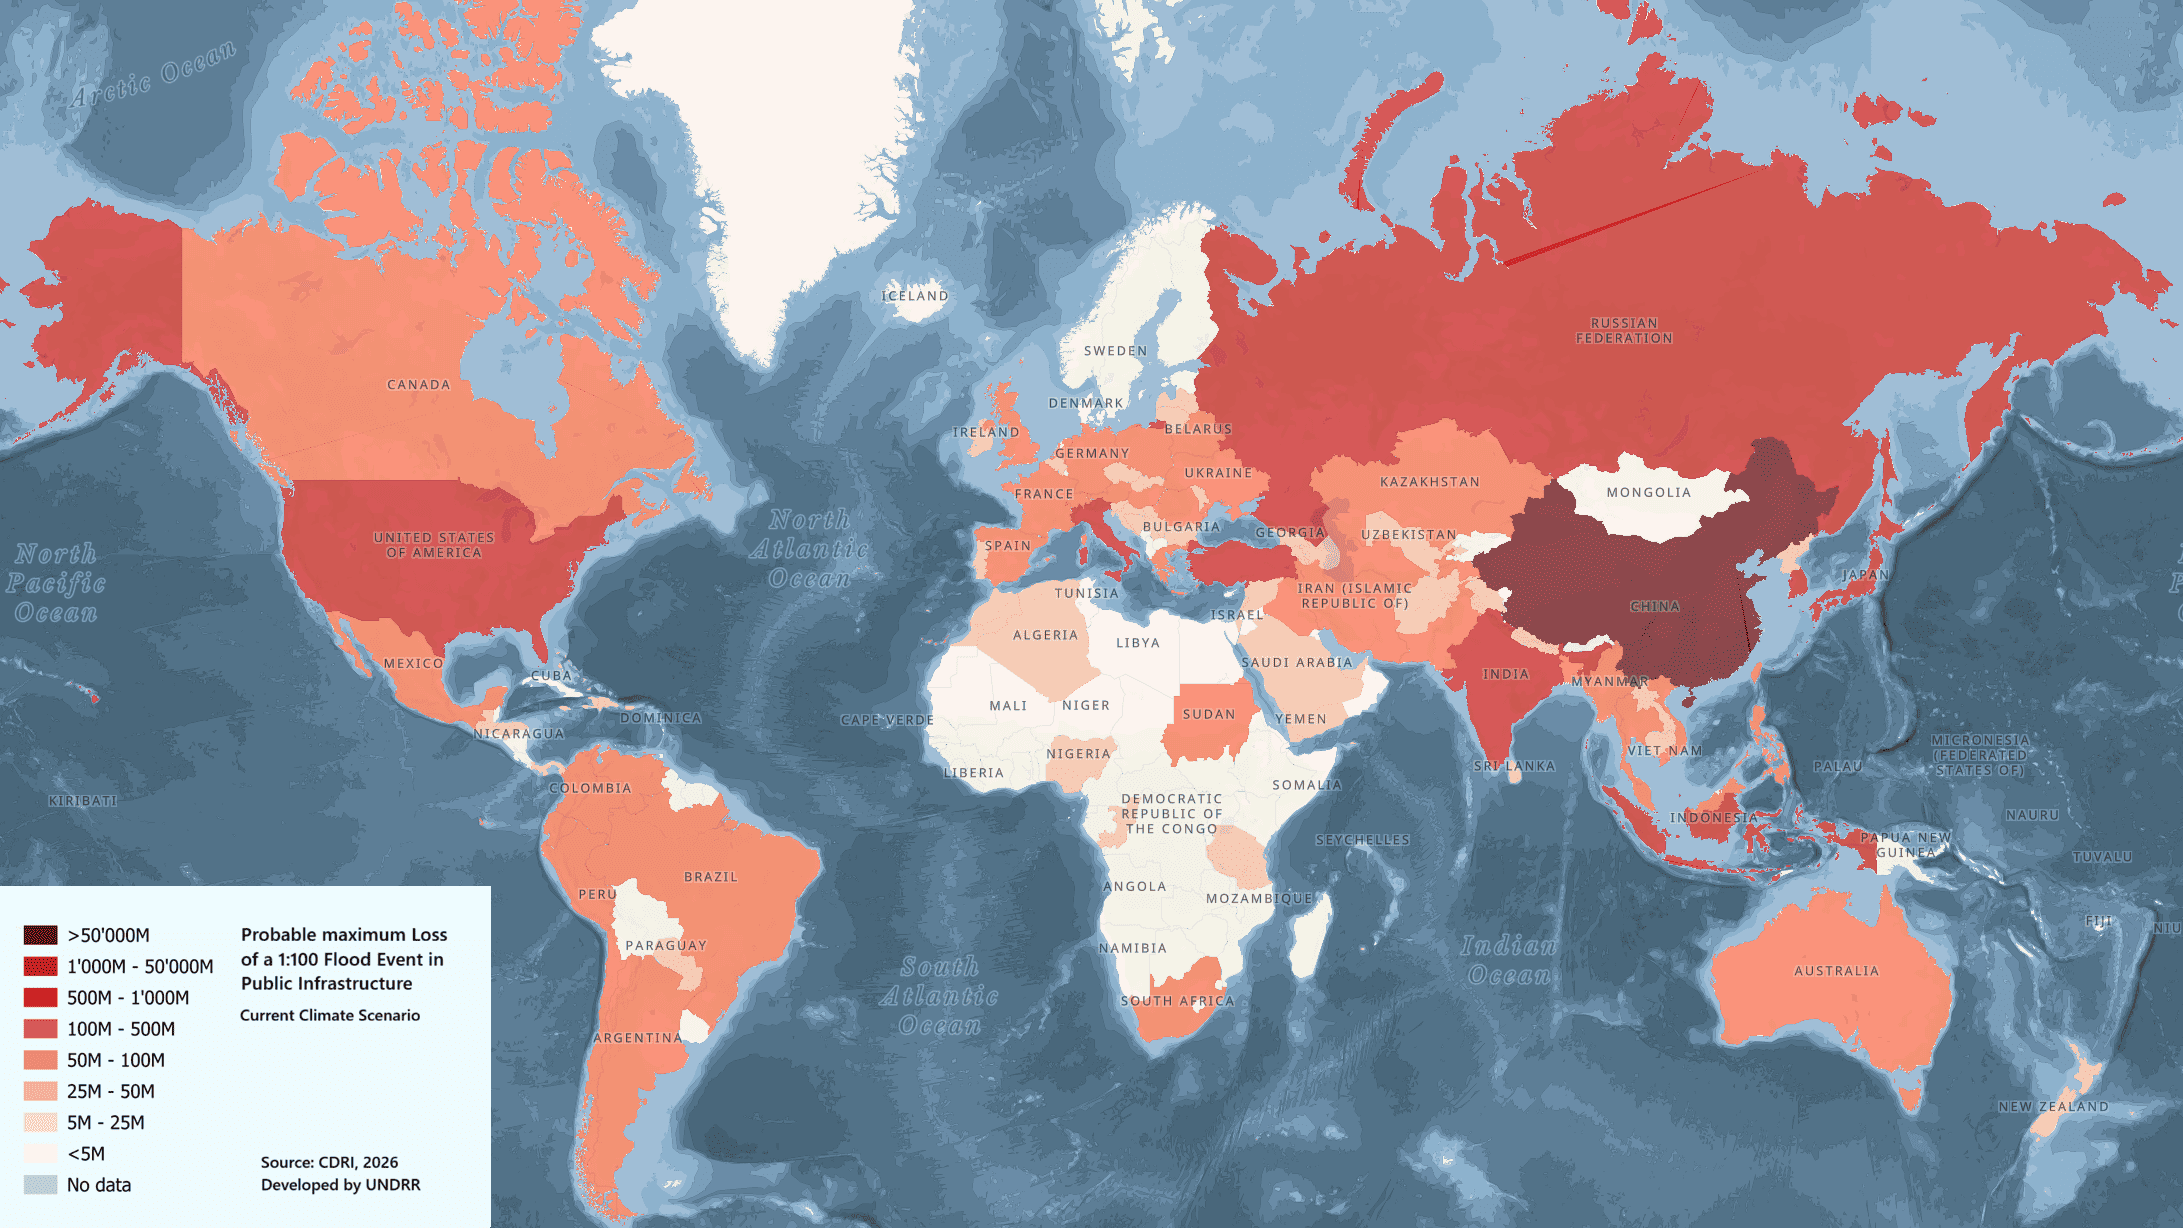
Built on the risk and resilience core metrics, the Map Viewer combines probabilistic hazard models, economic impact data, and resilience benchmarks into a single interactive visualization. Users can explore risk and resilience data across all countries and regions, compare scenarios, and examine the economic case for investing in resilience. The viewer is currently in development and will be launching soon.
2. The Global Risk & Resilience Metrics Country Profiles
The country profiles present a dashboard of the national values of the 38-core risk & resilience metrics, following the four steps of the risk & resilience framework, in a snapshot analysis.
Each country’s risk & resilience profile traces the path from current and future hazard risk, through social and economic vulnerability, to the cascading impacts on national finances and supply chains — and ultimately to the specific investments that can close the resilience gap.
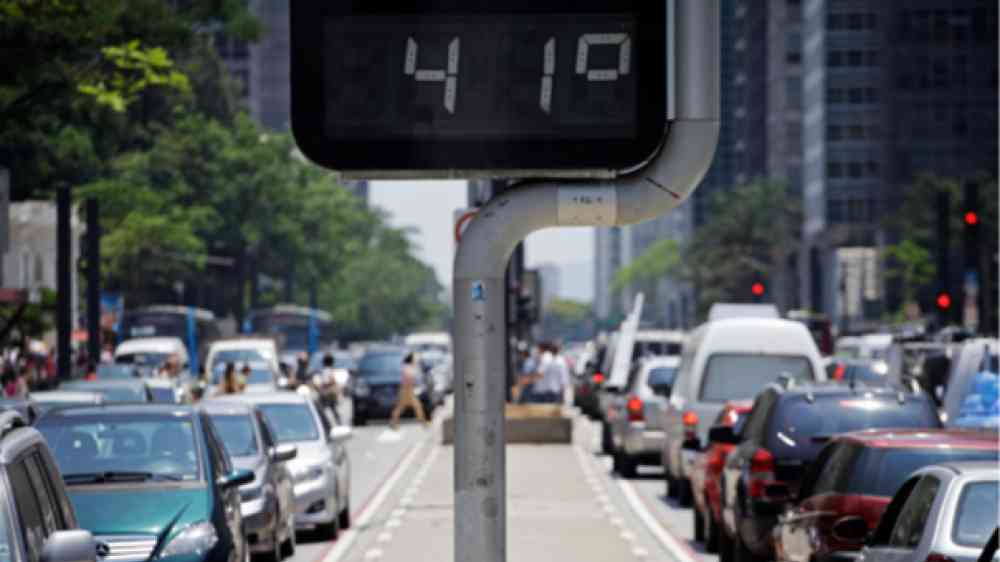
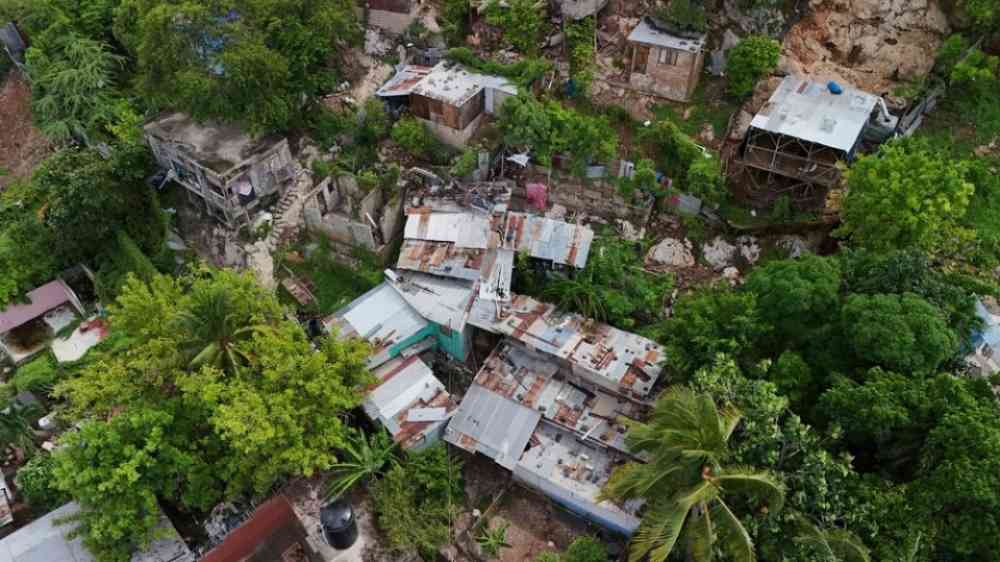
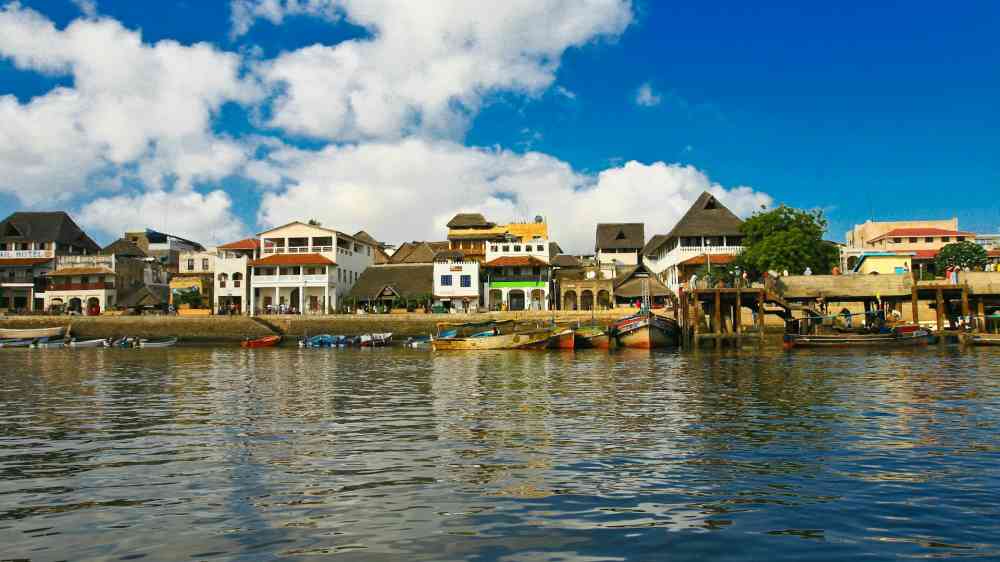
The country profiles support national government entities managing risk, development and planning to prioritize resilience investment to safeguard sectors most vulnerable from the future impact of principal hazards.
The country profiles are currently being developed and will be available in January 2027.

Led by UNDRR, the Facility is a coalition of technical collaborators and supporters from across the public and private sector
UNDRR · FCDO · XDI · IDF · GEM · Oxford University · UNEP-GRID · CDRI · World Bank · International Finance Corporation (IFC) · WMO · WHO · JRC · CIMA Foundation · UNDP · NGFS · Global Water Partnership · S&P Global · Howden · Oak Global · Carbon Bonds