
Methodology
The following methodology page provides technical understanding of the main concepts of the Risk and Resilience Metrics and, including their source, country coverage, methodological status and publication status. Some metrics are already available and are used in the current country profiles. Other metrics are under development, pending further methodological work, data availability or delivery by external providers.
For the Risk and Resilience Country Profiles, not only information coming from the Risk and Resilience Metrics is presented (which are listed in the methodology table below), but also additional disaster risk metrics, such as Average Annual Loss (AAL), Probable Maximum Loss (PML) and Loss Exceedance Curves (LEC) are shown and provide core evidence on expected and extreme-event losses, as well as Contextual socio-economic, fiscal and financing indicators, such as GDP, poverty, population, public debt, ODA and disaster-risk financing information, which support interpretation and country-level application. For additional sources and methodological notes are provided beneath the relevant charts or sections.
What are Annual Average Losses and How to Interpret Them?
Annual Average Losses (AAL) represent the expected value of economic losses per year due to disaster events. Rather than being a simple average, AAL is calculated as the area under the loss exceedance probability (LEC) curve, which models the full distribution of potential disaster losses, from frequent small events to rare catastrophic ones.
AAL is typically expressed in monetary terms, but can also reflect other types of losses, such as fatalities or infrastructure impacts, depending on the model and application. Derived from probabilistic risk models, AAL incorporates historical data and forward-looking hazard scenarios. The timeframe used for modeling varies by hazard type (100+ years for earthquakes, shorter for floods), ensuring robust long-term risk estimates.
Probable Maximum Loss (PML) represents the level of loss that could be exceeded with a specified probability in a given year, or equivalently, associated with a particular return period. For example, a 1-in-100-year PML corresponds to the loss level with a 1% probability of being exceeded in any given year. Unlike AAL, which summarizes the long-term average burden across the full range of possible events, PML focuses on the potential severity of infrequent, high-impact events. It can be expressed in monetary terms or through other impacts, such as fatalities or infrastructure damage, depending on the model and application.
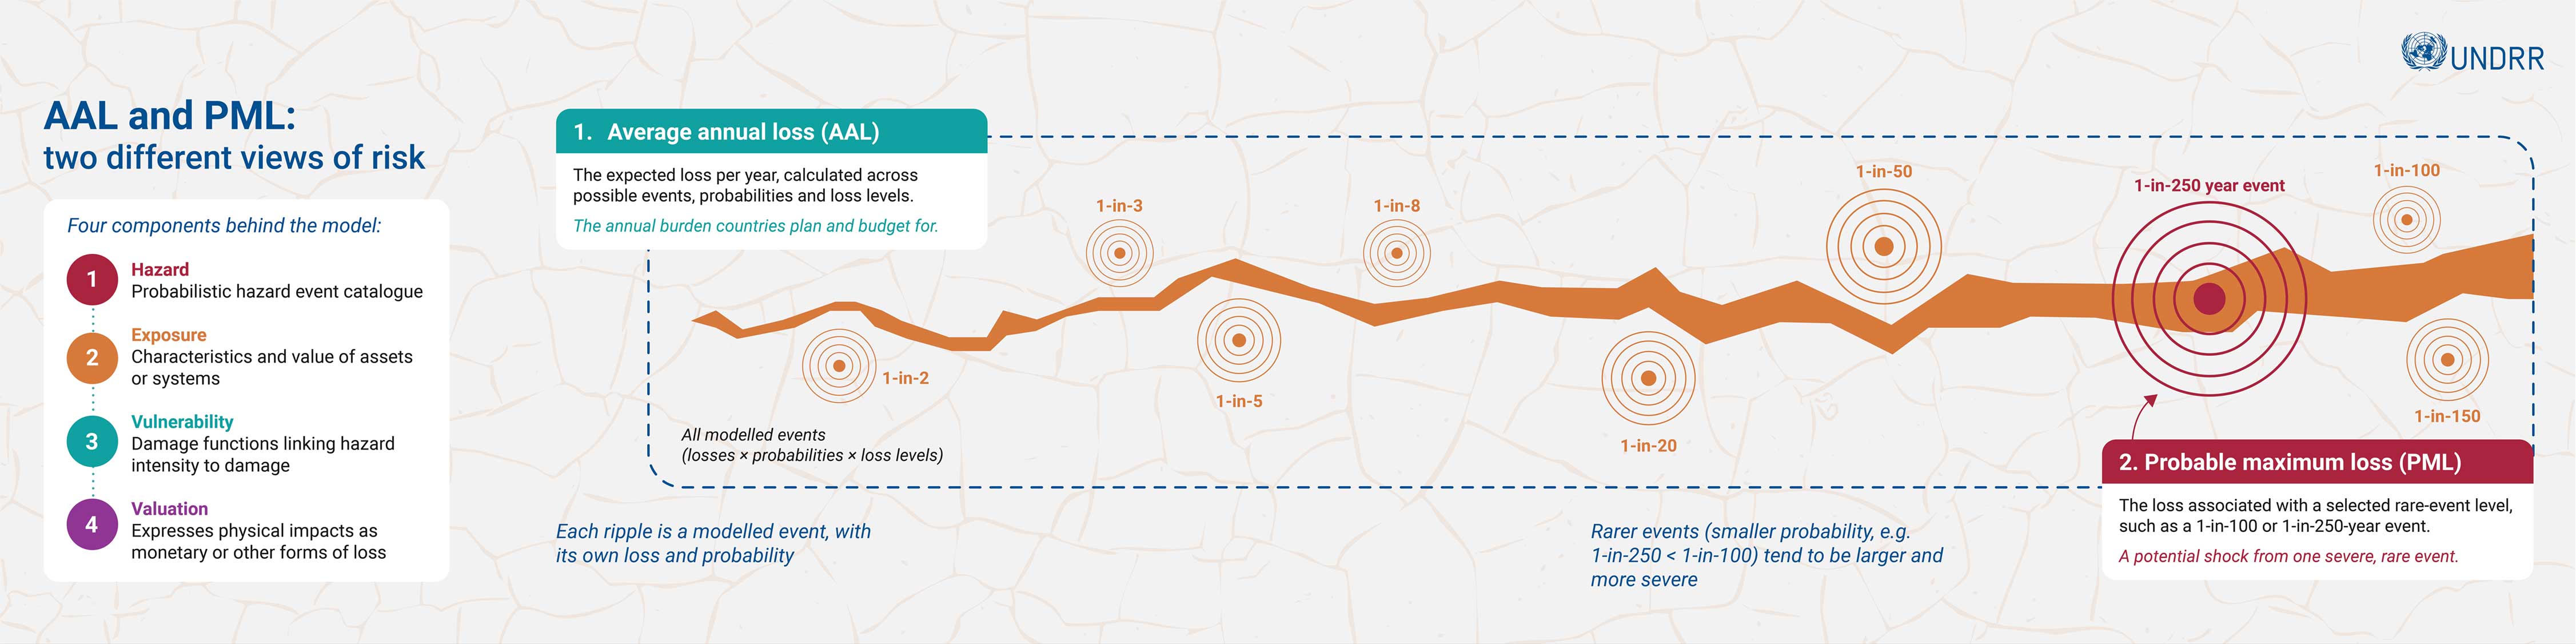
Technical definitions of Risk metrics (AAL - PML - LEC)
| Field | Average Annual Loss (AAL) | Probable Maximum Loss (PML) | Loss Exceedance Curve (LEC) |
|---|
Note: Values and interpretations depend on the hazards, exposed assets, vulnerability functions and model scope included in the underlying probabilistic risk model.
Taxonomy: definitions and current desegregations
The infrastructure-loss estimates presented in the framework draw on the exposure classifications used in the Coalition for Disaster Resilient Infrastructure’s Global Infrastructure Risk Model and Resilience Index (CDRI/GIRI). GIRI combines two related exposure models: one representing buildings and their uses, and another representing infrastructure systems and network
Building Exposure Model (BEM)
Represents residential and non-residential building stock. Non-residential uses include economic activities, government, education and health. The underlying education and health data distinguish between public and non-public facilities.
Infrastructure Exposure Model (IEM)
Represents infrastructure systems such as power, telecommunications, transport, water and wastewater, and oil and gas. These categories describe the function of the infrastructure, not necessarily whether the assets are publicly or privately owned.
| Displayed category | Exposure model | General coverage | Public/non-public distinction |
|---|---|---|---|
| Buildings | BEM | Residential and non-residential building stock represented in the global exposure model. Residential buildings are differentiated using income groups. Non-residential building uses include industry, services, government, education and health. | The broader building model includes both residential and non-residential uses. Education and health can be differentiated between public and non-public facilities in the underlying data. |
| Education | BEM | Building stock associated with education services. The global model uses information on pupils as a proxy for distributing education-related building exposure. | Public and non-public education facilities are distinguished where this disaggregation is available in the underlying dataset. |
| Health | BEM | Building stock associated with health services. The global model uses information such as hospital-bed capacity as a proxy for distributing health-related building exposure. | Public and non-public health facilities are distinguished where this disaggregation is available in the underlying dataset. |
| Power | IEM | Power-sector infrastructure represented in the GIRI Infrastructure Exposure Model. | The displayed category does not, by itself, identify whether assets are publicly or privately owned. |
| Telecommunications | IEM | Telecommunications infrastructure represented in the GIRI Infrastructure Exposure Model. | The displayed category does not, by itself, identify whether assets are publicly or privately owned. |
| Roads and railways | IEM | Road and railway infrastructure represented in the GIRI Infrastructure Exposure Model. | The displayed category does not, by itself, identify whether assets are publicly or privately owned. |
| Ports and airports | IEM | Transport infrastructure associated with ports and airports represented in the GIRI Infrastructure Exposure Model. | The displayed category does not, by itself, identify whether assets are publicly or privately owned. |
| Water and wastewater | IEM | Water-supply and wastewater infrastructure represented in the GIRI Infrastructure Exposure Model. | The displayed category does not, by itself, identify whether assets are publicly or privately owned. |
| Oil and gas | IEM | Oil- and gas-sector infrastructure represented in the GIRI Infrastructure Exposure Model. | The displayed category does not, by itself, identify whether assets are publicly or privately owned. |