
← Risk and Resilience Country Profiles
Côte d'Ivoire
This UNDRR Global Risk and Resilience Metrics Country Profile brings together risk modelling, climate science and data analytics to support public sector risk-informed planning and investment.
The analysis is based on globally consistent datasets developed with partners and available through the Risk & Resilience Map Viewer Site. As not all datasets are currently available at the global scale, some datasets based on national data are presented at the end of the profile. Links to the selected national data resources are also provided.
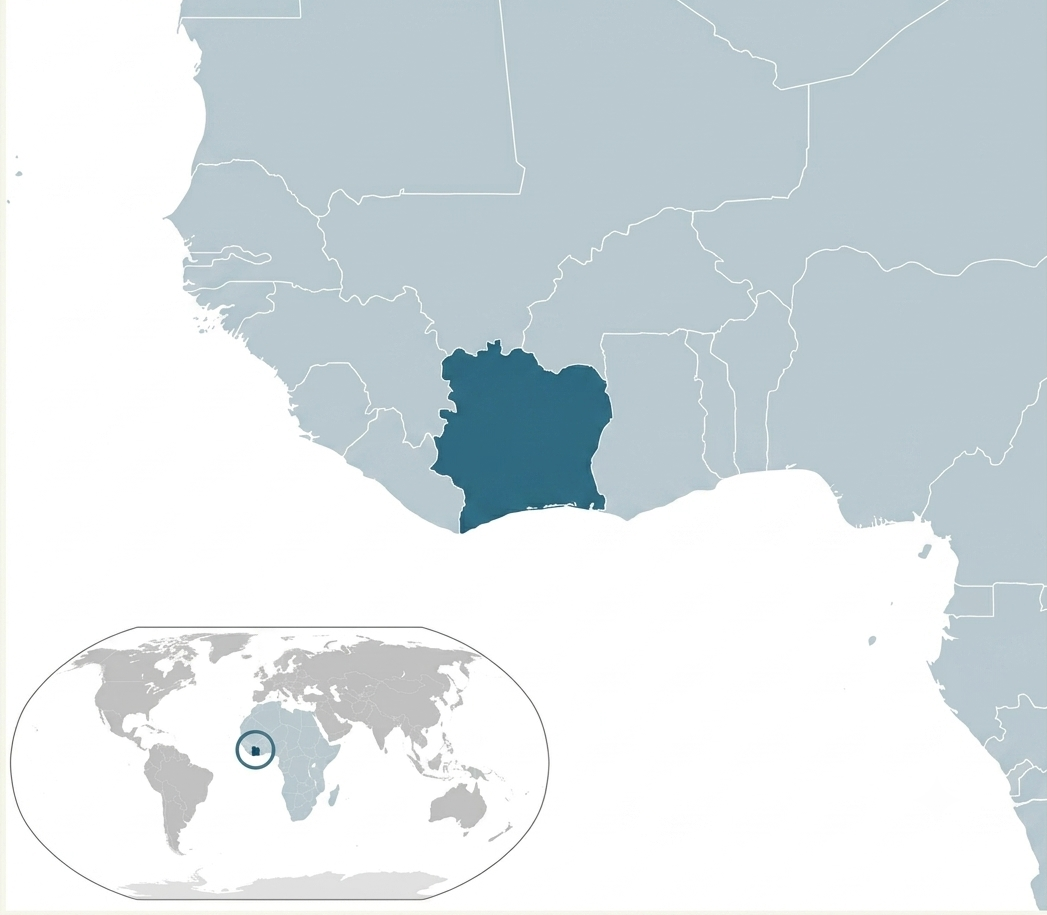
Source: UNDRR, 2026 using UN Geospatial
Note: The boundaries and names shown and the designations used on this map do not imply official endorsement or acceptance by the United Nations.
Socioeconomic context
The country sees a rapid demographic growth with 47.8% of the population being under the age of 18. Roughly 1 in every 3 people (34.9%) live in multidimensional poverty, while 1 in 5 (20.9%) live on less than USD 3 a day.
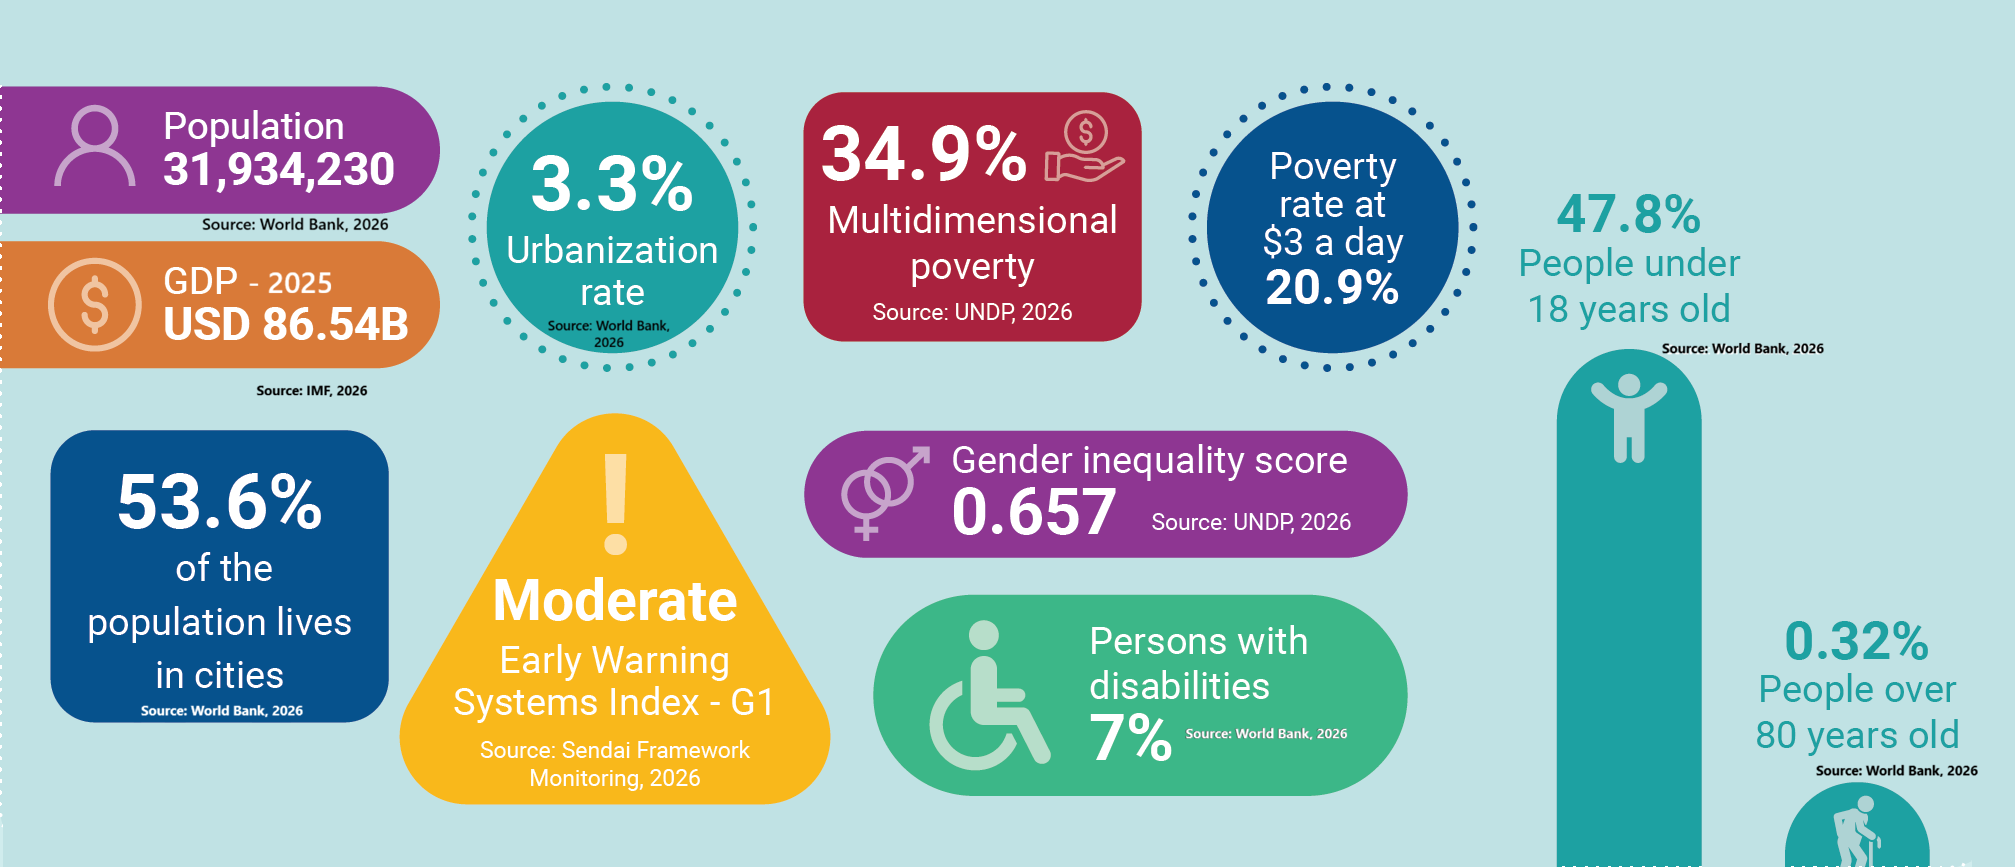
Source note: Indicator-level sources are shown in the graphic. For full metadata, including definitions, units, reference years, time coverage and source links, see the methodology.
CURRENT AND FUTURE RISK
1. Understanding current and future risk
Geographic distribution of hotspots for key hazards across the country
Flood risk is most concentrated in the southern and coastal parts of the country, especially around Abidjan, where population, infrastructure, and economic activity are highly concentrated. Earthquake risk is lower but could have major impacts in the southern urban corridor because of the density of buildings, power assets, and telecommunications infrastructure.
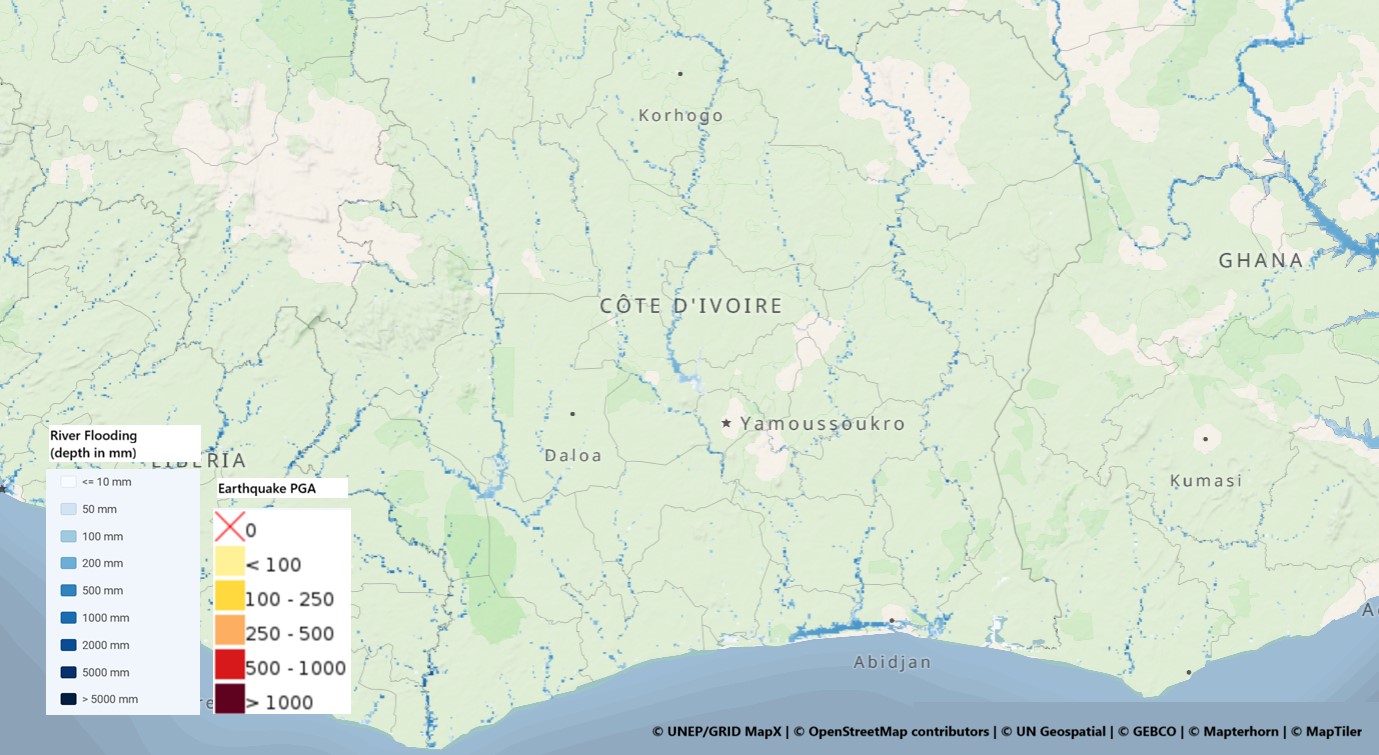
Source: UNDRR, 2026 using GEM Foundation (2026), JRC Global River Flood map (2024), and UNEP Grid MapX.
Note: The boundaries and names shown and the designations used on this map do not imply official endorsement or acceptance by the United Nations.
The first part of this analysis looks at modelled probabilistic risk from key hazards. The analysis factors in an average annual loss and probable maximum loss for the current costliest hazards.
For more information on probabilistic risk assessment and on data sources and approaches included in this analysis see the methodology section of the website.
Average Annual Losses (AAL) by hazards
Floods account for the largest share of modelled direct Average Annual Losses (AAL) in Côte d’Ivoire, representing over 90% of the total AAL shown in the chart. Earthquakes account for around 9%, while landslides represent a very small share, around 0.1%, at the national level.
Note: CDRI/GIRI AAL estimates cover modelled direct damages to buildings and infrastructure for selected hazards only. They do not yet provide comparable AAL estimates for all relevant hazards, including agricultural drought, heatwaves and wildfires. Figures should therefore be interpreted within the scope of the CDRI/GIRI methodology and not directly compared with estimates from other sources. UNDRR’s Risk and Resilience Metrics Facility aims to progressively develop methodologies to integrate these additional hazards into future comparable risk metrics.
Direct average annual losses (AAL) to infrastructure. (Costliest hazard)
Buildings account for the largest estimated losses from floods, at US$36.9 million per year, followed by power infrastructure at US$12.3 million, education assets at US$8.1 million, and telecommunications at US$6.0 million. Losses in the remaining sectors are lower, including oil and gas at US$0.68 million, roads and railways at US$0.57 million, water and wastewater at US$0.16 million, ports and airports at US$0.09 million, and health infrastructure at US$0.01 million.
Note: Information presented for the CDRI/GIRI top hazard's AAL estimation.
Direct average annual losses (AAL) to infrastructure. (Second most costly hazard)
Buildings account for the largest estimated losses from earthquakes, at US$2.67 million per year, followed by power infrastructure at US$1.41 million, telecommunications at US$0.84 million, and education assets at US$0.59 million. Losses in the remaining sectors are lower, including roads and railways at US$0.33 million, water and wastewater at US$0.26 million, oil and gas at US$0.09 million, ports and airports at US$0.02 million, and health infrastructure at approximately US$0.00 million.
Note: Information presented for the CDRI/GIRI second-top hazard's AAL estimation.
Expected economic losses in 1-in-100 year event (Probable Maximum Loss - PML)
Based on CDRI/GIRI estimates, flooding represents Côte d’Ivoire’s largest modelled 1-in-100-year loss, reaching approximately US$443.4 million, followed by earthquakes at around US$79.5 million and landslides at less than US$1 million.
Direct Average Annual Losses (AAL) to public infrastructure
Flood-related losses are higher than earthquake-related losses in both sectors. Education infrastructure accounts for the largest losses, with estimated annual losses of around US$5.77 million from floods and US$0.42 million from earthquakes. Estimated losses to health infrastructure are much lower, at around US$1,251 from floods and US$90 from earthquakes.
Direct Probable Maximum Losses (PML) to public infrastructure
Floods produce the largest sector-level PML estimates, particularly for power (US$86.3 million) and telecommunications (US$43.8 million). These sectors also record the highest earthquake PMLs, at US$18.1 million and US$10.7 million, respectively. Estimated losses are lower across the remaining sectors.
Direct Average Annual Losses (AAL) to housing
Losses are highest for the low-middle income class, at around US$12.23 million per year. The middle income class records estimated annual losses of around US$2.46 million, while the low income class records around US$1.11 million. The high income class shows no estimated losses in this dataset.
NATIONAL VULNERABILITY PROFILE
2. Social and economic exposure
The analysis in this section looks at key socioeconomic indicators for the country that impact its vulnerability and exposure to disasters. It also includes modelled analysis of how this may impact recovery for specific socio-economic groups to financially recover, based on UNDRR - World Bank analysis. See the methodology for details.
Recovery speed of top/bottom income groups from a 1-in-100 year event
In Côte d’Ivoire, a 1-in-100-year event could reduce consumption by up to 70% for the poorest households, compared to 41% for the richest, with similar gaps observed for floods. This shows that the poorest households lose less in assets but far more in consumption power, as they have fewer savings, limited access to credit, and weaker coping mechanisms.
Consumption loss levels after a 1-in-100 year hazard event by households income quintile
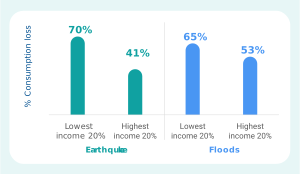
Source: UNDRR based on GAR 2025 and World Bank, 2025
Recovery of household consumption and asset ownership resilience after an extreme event
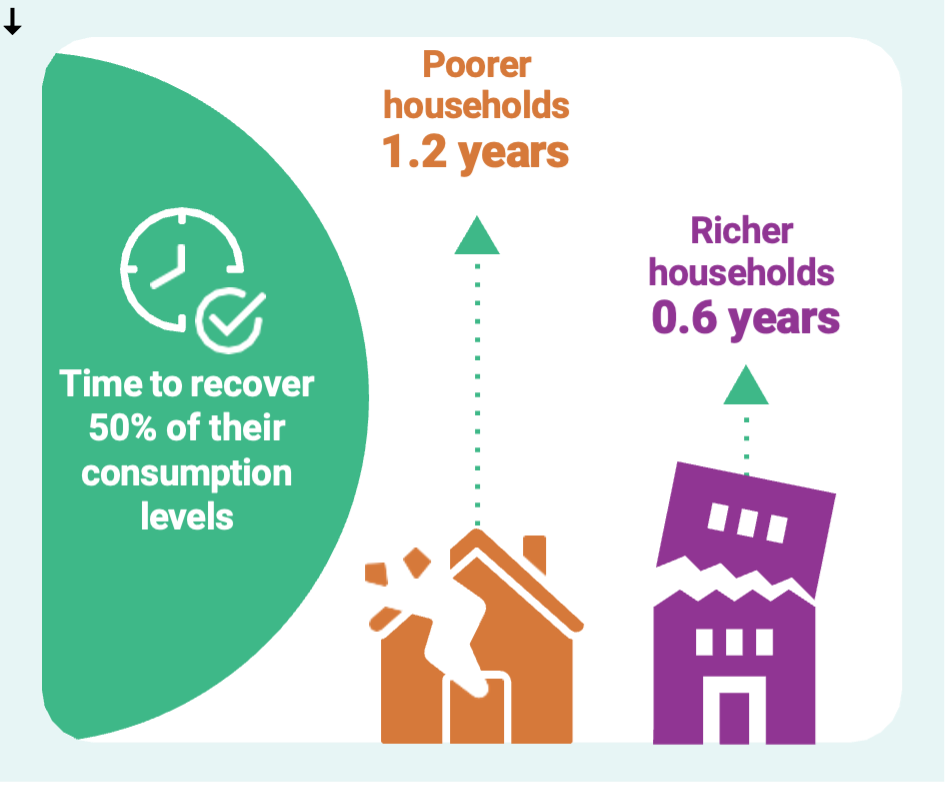
Modelled data suggests that after one year, the poorest recover only 43% of their consumption levels, compared to 66% for the richest, and it takes them twice as long to recover half of their losses (1.2 years vs. 0.6 years).
Time to recover 50% of consumption levels after a 1-in-100 year hazard event by households income quintile
Source: UNDRR based on GAR 2025 and World Bank, 2025
CLIMATE AND FINANCIAL STABILITY
3. Economic and financial instability risk
This section uses the IMF DIGNAD methodology to explore the impact of Cote d'Ivoire major disasters on the wider economy and specifically GDP losses and public debt. These results assume a 1-in-100 year event. See methodology for details.
Probable Maximum Losses of real GDP now and 2050
The results show that direct damages to physical assets have relatively limited impacts on Côte d'Ivoire’s economy. For a 1-in-100 year event, the model results present a projected decline of between -0.1 and -0.3% for floods and between -0.005 and -0.055 for earthquakes, coming from mainly privately owned homes and commercial and industrial buildings.
Chance of a disaster exceeding public financing capacity (Fiscal gap)
The PML from 1-in-100 year event flood would raise the debt ratio marginally from 56.6% of GDP to between 56.7 and 56.9%. The debt is projected to decline again after the shock because the estimated increase is small and economic growth continues to support debt reduction. If the government maintains its fiscal consolidation plans, debt could fall faster than shown in the model.
Sovereign debt due to an extreme event
Flood has the largest relative scale across the indicators shown, equivalent to around 0.5% of Côte d’Ivoire’s 2025 GDP. Relative to public finances, the flood PML is equivalent to around 3% of annual government revenue, 2.5% of annual public expenditure and 0.9% of gross public debt. Earthquake and landslide PMLs are lower across the indicators shown.
These figures suggest that the modelled 1-in-100-year losses are limited at the aggregate macro-fiscal level. However, they may still create sector-specific reconstruction needs or localised fiscal pressures, depending on the assets and areas affected. The comparison should be read as a scale indicator, not as a direct estimate of how much public debt would increase after the event.
RESILIENCE OPTIONS
4. Current resilience investment
This section draws on information compiled in UNDRR's Finance Observatory. It provides a snap-shot of current investment in risk reduction and resilience building, and the extent of anticipatory and resilience finance available based on publicly available data.
For more information on the criteria and scaling used for these financial indicators, see the methodology for details.
Available data identifies US$2.2 million in pre-arranged financing through the African Risk Capacity mechanism (ARC) and average humanitarian relief expenditure of US$2.3 million per year over 2020–2024, equivalent to 0.2% of total ODA. Indicators on DRR and resilience financing relative to GDP, planned resilience spending relative to AAL/PML, emergency funding requirements and anticipatory action/prevention spending are not yet available for this profile.
5. Potential for loss and volatility reduction
This section draws on a series of country-specific diagnostic studies and policy assessments for the country. Together, they explore the potential to reduce disaster losses and economic volatility, and illustrate how resilience measures can change fiscal, economic, social and environmental outcomes.
Unlike the globally comparable metrics presented earlier in the profile, these studies use different models, assumptions, reference years and data sources, and may incorporate national calibrated information. As we build out the dataset through the Facility in the interim, the data below is based on national data and detail hypothesis.Their results should therefore be interpreted within the scope of each individual study and should not be directly compared with one another or with the global metrics.
For further information on the methodology, assumptions and sources used in each analysis, see the methodology page and the source links beneath each chart.
Coastal flood impact on real GDP deviation from steady state
A major coastal flood could affect Côte d’Ivoire’s economy. Without resilience investment, real GDP is estimated to fall by up to 6% below its expected path. With resilience investment, the deviation is smaller, at around 4%, and the model shows a faster return toward the baseline.
In this scenario, the resilience investment pathway is associated with a smaller GDP deviation and faster recovery than the no-resilience pathway. Results should be interpreted within the assumptions of the simulation.
Public debt impact of a severe coastal flood scenario
A World Bank/IMF DSA simulation shows that a severe coastal flood shock could temporarily worsen Côte d’Ivoire’s debt trajectory. Under this scenario, public debt rises from around 53% to about 62% of GDP shortly after the shock, before gradually declining. This result should be read as a DSA stress scenario, not as directly comparable to the Oxford DIGNAD PML estimates, which use a different damage input, baseline and scenario design.
Coastal flood impact on total public debt (Debt Financing)
After a coastal flood, public debt would increase in both scenarios, but the outcome is very different depending on investment choices. Without resilience investment, debt could rise to around 68% of GDP and remain high over time. With resilience investment, debt would increase more slowly and stabilize at around 60% of GDP. Investing in resilience not only reduces losses, but also helps keep public debt under control in the long run.
Two approaches to funding disasters
Financing disaster losses differs significantly depending on the strategy adopted. Under a base approach, costs are split evenly between post-budget reallocations and ex-post sovereign borrowing, increasing fiscal pressure after the event. In contrast, a layered financing strategy shifts a larger share toward pre-arranged instruments, with over 60% covered through planned mechanisms, reducing reliance on costly post-disaster borrowing. The layering approach strengthens fiscal resilience by spreading risk, improving liquidity, and limiting long-term debt accumulation
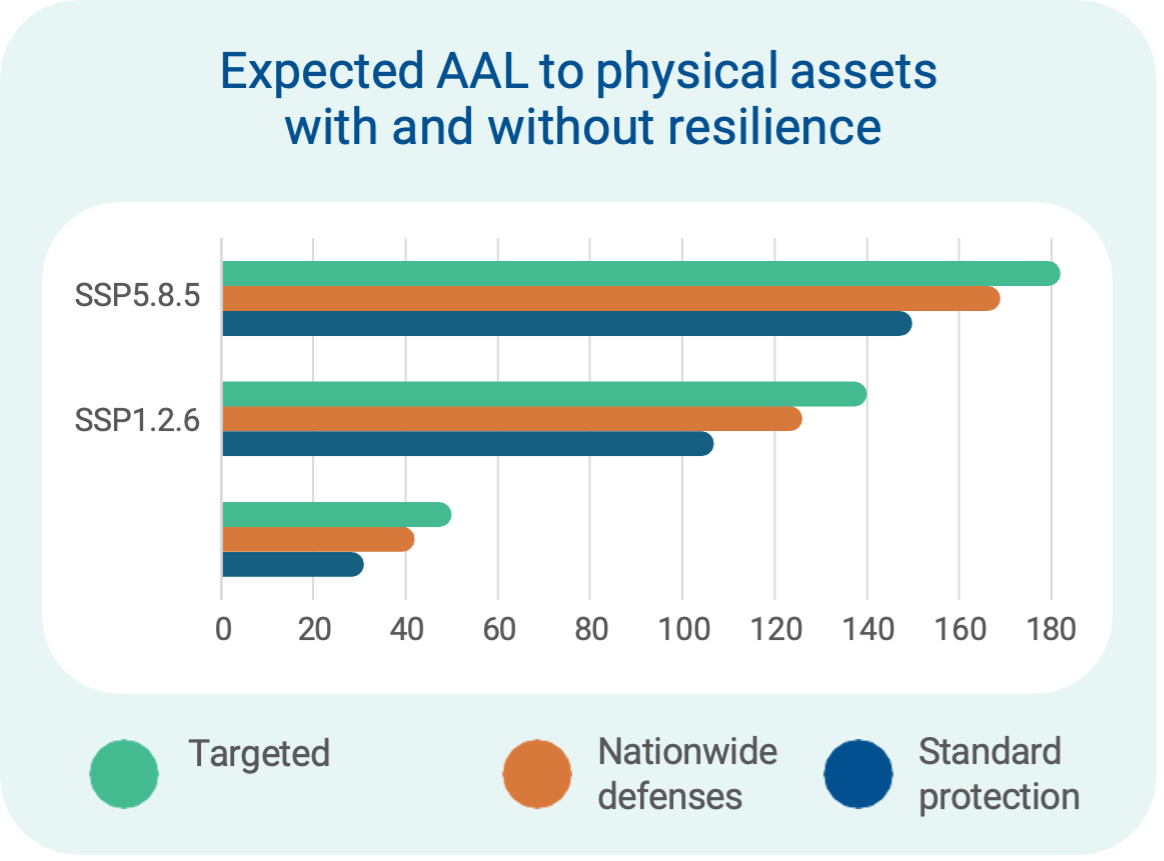
Direct losses from floods on crops area: without and with protection measures
Flood losses to crop areas in Côte d’Ivoire are expected to increase significantly under future climate scenarios, but protection measures can substantially reduce these impacts. Annual flood losses to crop areas are expected to rise sharply under future climate scenarios, reaching up to USD 182 million per year under high warming. Protection measures can substantially reduce these recurring losses, especially when targeted to high-risk agricultural areas.
Source: CIMA Foundation, 2025 (unpublished paper)
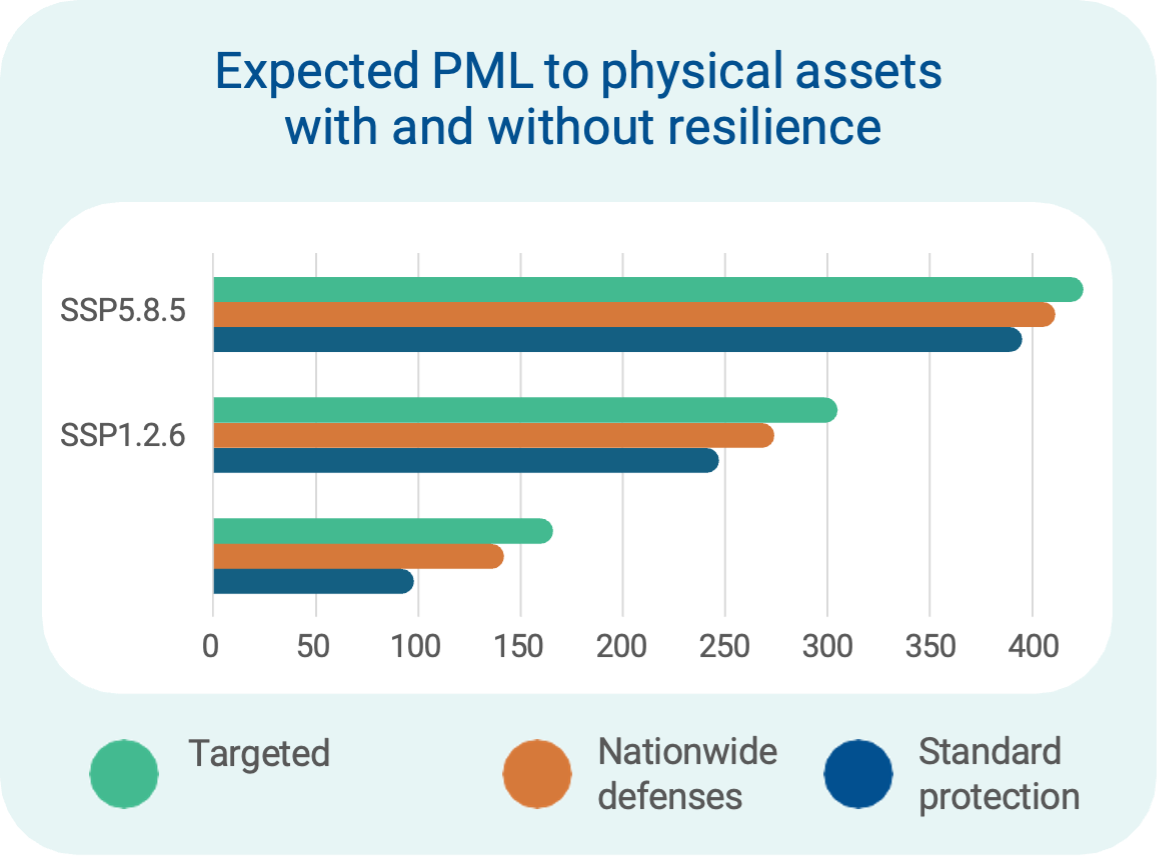
Expected PML to physical assets
For a 1-in-100-year flood event, crop losses could reach up to USD 425 million under high warming. Strengthening flood protection could significantly reduce these extreme shocks, helping safeguard food production, rural livelihoods, and fiscal stability.
Source: CIMA Foundation, 2025 (unpublished paper)
Coastal flood losses and climate investment (%GDP)
According to IMF-cited World Bank estimates, the annual cost of coastal floods in Côte d’Ivoire is around 4% of GDP. Planned climate investment represents about 2.7% of GDP per year, including 1.5% for adaptation and 1.25% for mitigation. This means that even total planned climate investment remains below the estimated annual cost of coastal floods. The comparison should be read as an indication of scale, not as a one-to-one adequacy threshold: adaptation and mitigation spending do not need to equal annual losses every year to be effective. Rather, the figures highlight the importance of targeting adaptation finance toward the coastal risks, assets and locations where avoided losses could be greatest.
Adaptation benefit to poverty headcount (%)
Without adaptation, poverty reduction slows down under climate stress. Even in a high-growth pathway, poverty remains higher under climate-affected scenarios (dry-hot and wet-warm) compared to the baseline, showing that climate change can slow progress and increase inequality, especially for more vulnerable populations.
Adaptation benefit to poverty headcount (%)
With adaptation, poverty declines faster and more evenly across scenarios. The gap between climate scenarios and the baseline becomes smaller, meaning that adaptation helps protect vulnerable households and reduces inequality, supporting more inclusive growth despite climate risks.
Links to the National Government DRR analysis
Côte d'Ivoire's Disaster Management Agency has an active website for flood risk analysis. It has also recently conducted downscaled probabilistic flood modeling, which is accessible through this site.
Disclamer
The results presented are based on probabilistic risk modelling and forward-looking climate and economic projections. Average Annual Loss (AAL) and Probable Maximum Loss (PML) estimates reflect expected losses over long time horizons rather than specific events or years. As with all model-based analyses, results depend on assumptions related to hazard frequency and intensity, exposure, vulnerability, and future socioeconomic pathways.These findings should be interpreted as indicative of relative risk patterns and potential magnitudes, rather than precise forecasts. Methodologies to expand coverage of hazards such as droughts, heatwaves and wildfires are currently under development.