
← Risk and Resilience Country Profiles
Kenya
This UNDRR Global Risk and Resilience Metrics Country Profile brings together risk modelling, climate science and data analytics to support public sector risk-informed planning and investment.
The analysis is based on globally consistent datasets developed with partners and available through the Risk & Resilience Map Viewer Site. As not all datasets are currently available at the global scale, some datasets based on national data are presented at the end of the profile. Links to the selected national data resources are also provided.
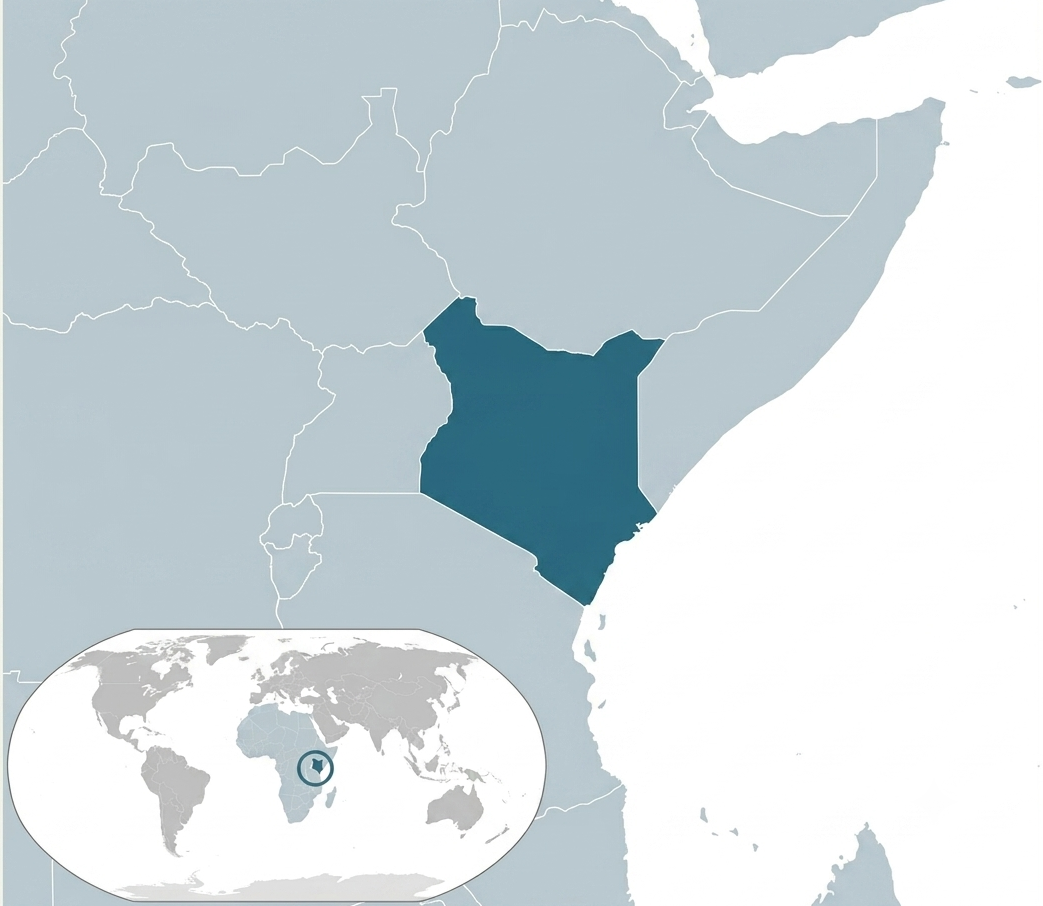
Source: UNDRR, 2026 using UN Geospatial
Note: The boundaries and names shown and the designations used on this map do not imply official endorsement or acceptance by the United Nations.
Current socio-economic context and recovery
Kenya’s population of 51 million is predominantly rural, with only 30 per cent living in cities. Multidimensional poverty affects 44.7 per cent of the population. This vulnerability is reinforced by broader structural factors. A large share of the population is young, with over a third under the age of 18. Gender inequality remains significant, shaping unequal access to income, assets, and opportunities. Persons with disabilities and other vulnerable groups face additional barriers to accessing support and services. At the same time, early warning systems remain limited, reducing the ability of communities to anticipate and respond to hazards effectively.
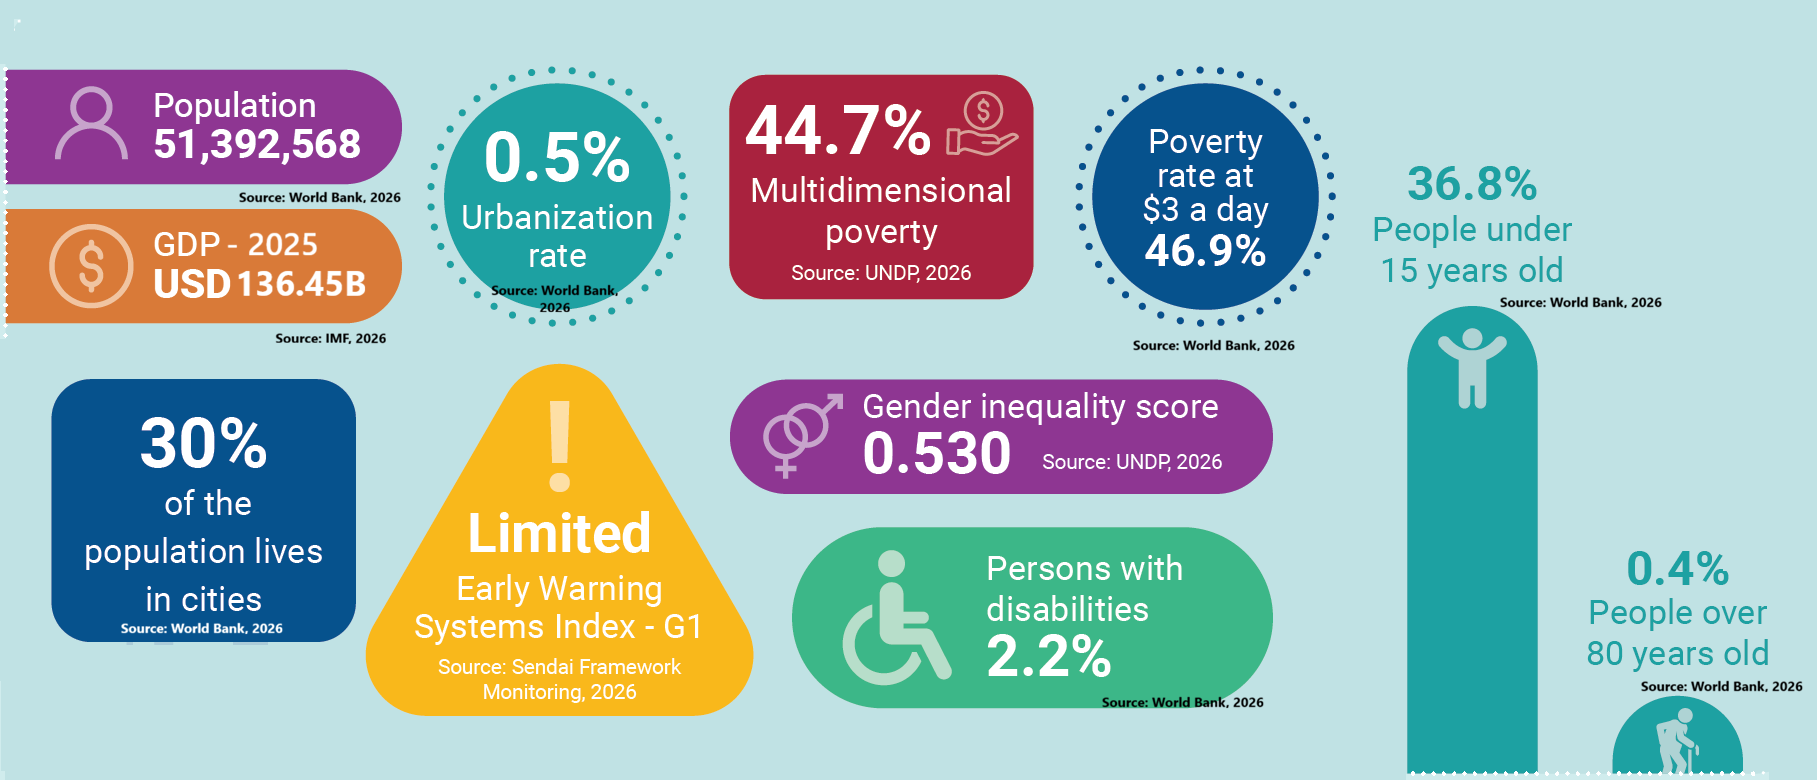
Source note: Indicator-level sources are shown in the graphic. For full metadata, including definitions, units, reference years, time coverage and source links, see the methodology.
CURRENT AND FUTURE RISK
1. Understanding current and future risk
Geographic distribution of hotspots for key hazards across the country
Extreme drought in northern areas is one of the main drivers of economic losses in Kenya. This risk is amplified by frequent and destructive flooding in the Lake Victoria Basin, along major river systems, and in fast-growing urban centres such as Nairobi. In the Central Highlands and other steep, densely populated areas, intense rainfall also creates landslide risk.
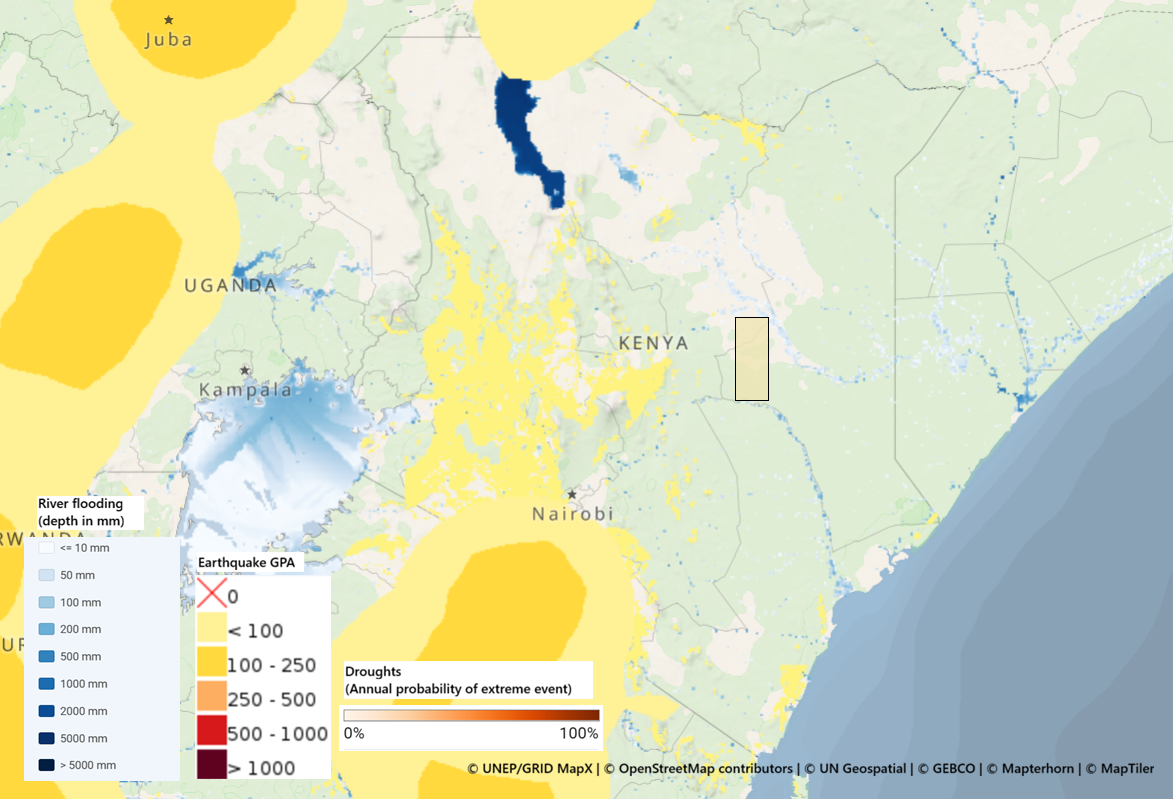
Source: UNDRR, 2026 using GEM Foundation (2026), JRC Global River Flood map (2024), Lange et al - ISIMIP model (2020), and UNEP Grid MapX.
Note: The boundaries and names shown and the designations used on this map do not imply official endorsement or acceptance by the United Nations.
The first part of this analysis looks at modelled probabilistic risk from key hazards. Analysis factors in an average annual loss and probable maximum loss for the current costliest hazards.
For more information on probabilistic risk assessment and on data sources and approaches included in this analysis see the methodology section of the website.
Average Annual Losses (AAL) by hazards
Floods account for the largest share of modelled direct Average Annual Losses (AAL) in Kenya, representing more than 60% of the total AAL shown in the chart, around US$125 million out of approximately US$200 million. Earthquakes represent the second largest share, at around 30% of modelled direct AAL. Landslides account for a much smaller share at around 1%.
Note: Drought is not included in this AAL distribution, but remains central to Kenya’s risk profile given the importance of agriculture for livelihoods, employment and climate exposure. Further information on drought risk metrics will be provided soon.
Note: CDRI/GIRI AAL estimates cover modelled direct damages to buildings and infrastructure for selected hazards only. They do not yet provide comparable AAL estimates for all relevant hazards, including agricultural drought, heatwaves and wildfires. Figures should therefore be interpreted within the scope of the CDRI/GIRI methodology and not directly compared with estimates from other sources. UNDRR’s Risk and Resilience Metrics Facility aims to progressively develop methodologies to integrate these additional hazards into future comparable risk metrics.
Direct average annual losses (AAL) to infrastructure. (Costliest hazard)
Losses from floods are concentrated in buildings and key public-service infrastructure. Buildings account for the largest share of modelled losses, at around US$85.1 million, followed by education assets at US$21.4 million and power infrastructure at US$8.3 million. Telecommunications, roads and railways, water and wastewater, health facilities, ports and airports, and oil and gas assets account for smaller shares.
Note: Information presented for the CDRI/GIRI top hazard's AAL estimation.
Direct average annual losses (AAL) to infrastructure. (Second most costly hazard)
Earthquake losses are also concentrated in buildings and public-service infrastructure. Buildings account for the largest share of modelled losses, at around US$37.6 million, followed by education assets at US$9.4 million, telecommunications at US$4.1 million, roads and railways at US$3.8 million, water and wastewater at US$2.1 million, and power infrastructure at US$2.1 million. Health, ports and airports, and oil and gas assets account for smaller shares.
Note: Information presented for the CDRI/GIRI top hazard's AAL estimation.
Expected economic losses in 1-in-100 year event (Probable Maximum Loss - PML)
Kenya’s selected extreme-loss estimates show that drought and flood risks could generate the largest losses among the hazards and sectors presented. However, these values should be interpreted by source and scope. Flood, tsunami and landslide estimates refer to CDRI/GIRI modelled direct damages to buildings and infrastructure, while drought and ecosystem-related estimates come from separate sectoral analyses. The chart therefore highlights the breadth of Kenya’s exposure across built assets, agriculture and natural systems, rather than providing a fully harmonised ranking of all hazards
Direct Average Annual Losses (AAL) to public infrastructure
In the education sector, wind has the highest estimated losses, at around US$16.04 million per year, followed by storm surge at US$15.59 million, earthquakes at US$9.65 million, and floods at US$4.58 million. Health infrastructure losses are lower across all hazards, with estimated annual losses of around US$109,082 from wind, US$106,072 from storm surge, US$65,673 from earthquakes, and US$31,148 from floods.
Direct Probable Maximum Losses (PML) to public infrastructure
The largest sector-level estimate is associated with flood impacts on power infrastructure, at approximately US$55.9 million. Earthquake-related losses are highest for telecommunications (US$53.0 million) and roads and railways (US$49.3 million), followed by power and water and wastewater infrastructure, both at around US$27 million. For floods, the largest estimates after power are recorded for telecommunications (US$35.8 million) and roads and railways (US$27.0 million). Rain-related losses are reported only for roads and railways, at US$20.6 million. Tsunami-related losses are lower across the sectors shown, with telecommunications recording the highest estimate at US$9.4 million. Oil and gas, and ports and airports, record comparatively low PML estimates across the modelled hazards.
Direct Average Annual Losses (AAL) to housing
The largest losses are reported for the low-middle income class across all hazards, with around US$26.02 million from floods, US$11.45 million from earthquakes, and US$2.80 million from tsunamis. The low income class records estimated losses of around US$4.31 million from floods, US$1.90 million from earthquakes, and US$0.50 million from tsunamis. For high income and middle income classes no values are reported.
VULNERABILITY
2. Social and economic exposure
The analysis in this section looks at key socioeconomic indicators for the country that impact its vulnerability and exposure to disasters. It also includes modelled analysis of how this may impact recovery for specific socio-economic groups to financially recover, based on UNDRR - World Bank analysis. See the methodology for details.
Recovery speed of top/bottom income groups from a 1-in-100 year event
Disasters do not affect all households equally. In a 1-in-100-year flood event, consumption among the poorest households could be expected to fall by 62 per cent, compared to 49 per cent among the richest. For earthquakes, the gap is even wider: the poorest 20 per cent face a 70 per cent consumption loss, against just 30 per cent for the wealthiest.
Consumption loss levels after a 1-in-100 year hazard event by households income quintile
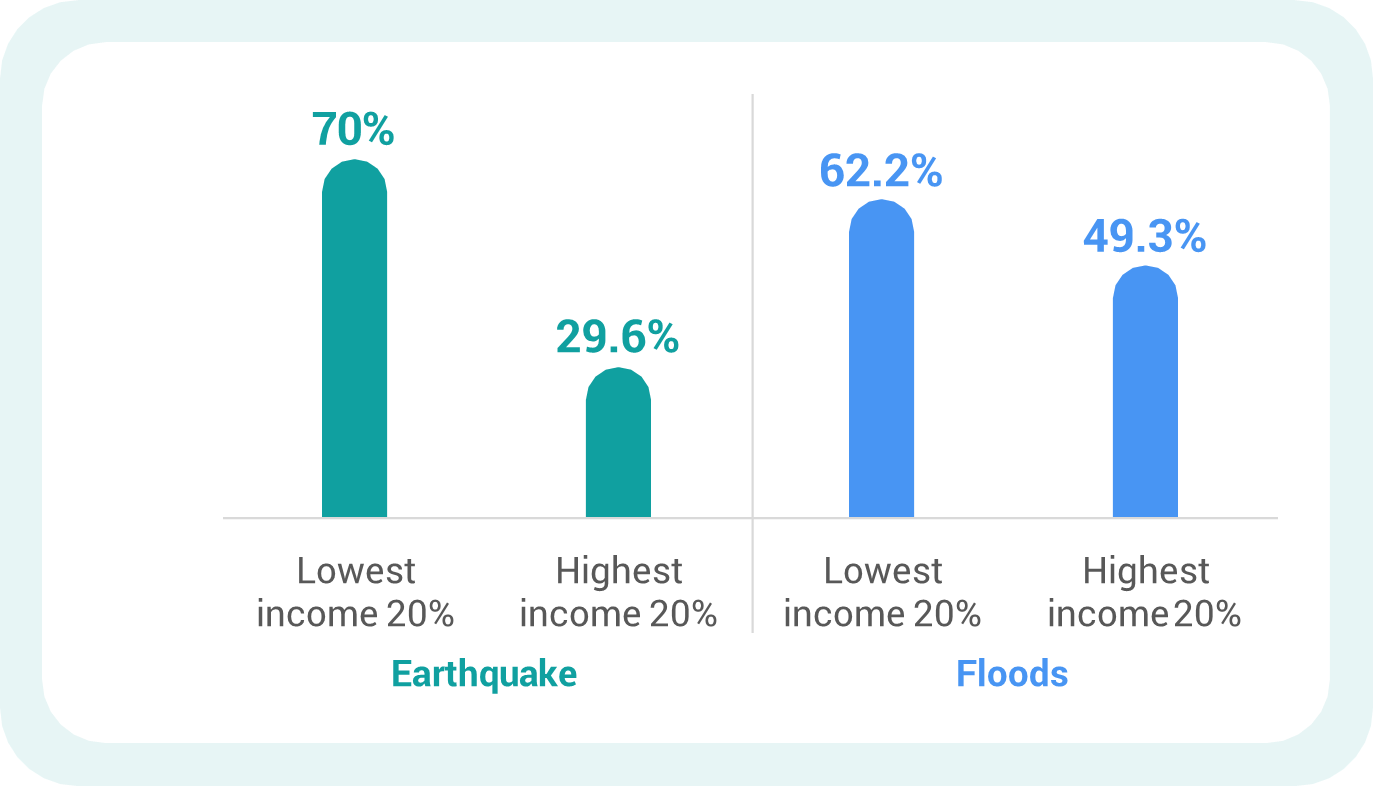
Source: UNDRR based on GAR 2025 and World Bank, 2025
Recovery of household consumption and asset ownership resilience after an extreme event
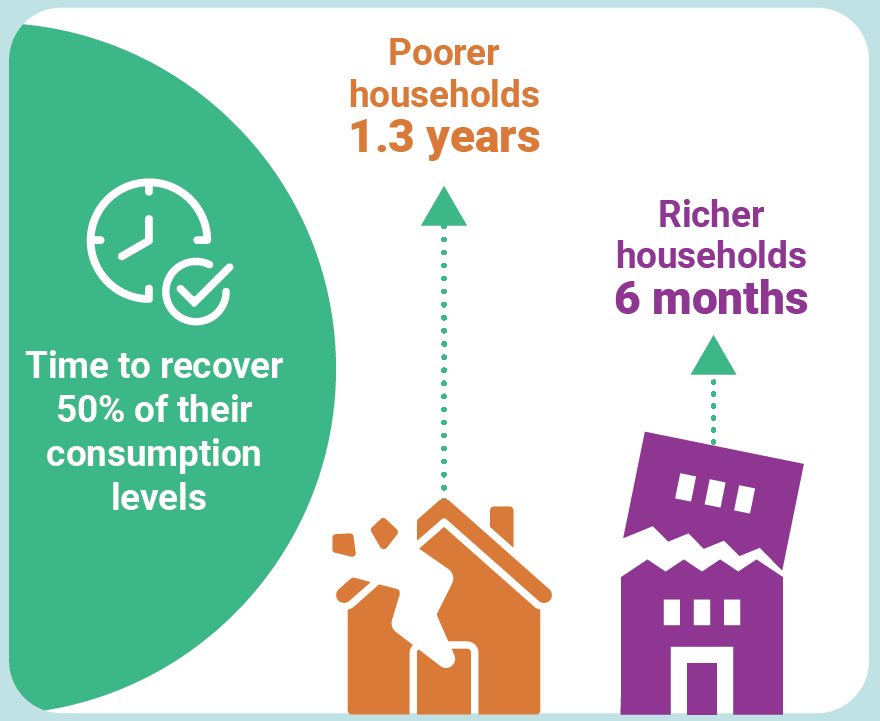
Poor households take 1.3 years to recover 50 per cent of their consumption levels after an extreme event, while richer households reach the same recovery threshold in around six months. This indicates that poorer households experience a longer recovery period in the modelled scenario, in addition to higher consumption losses.
Time to recover 50% of consumption levels after a 1-in-100 year hazard event by households income quintile
Source: UNDRR based on GAR 2025 and World Bank, 2025
FINANCIAL STABILITY
3. Economic and financial instability risk
This section uses the IMF DIGNAD methodology to explore the impact of Kenya's major disasters on the wider economy and specifically GDP losses and public debt. These results assume a 1-in-100 year event. See methodology for details.
Probable Maximum Losses of real GDP now and 2050
In contrast to Kenya’s high vulnerability to climate and disaster-related risks, the model shows limited impacts from flood and earthquakes on the economy and fiscal trajectories. The main reason is the model considers only the direct damages to built physical assets (buildings and infrastructure), which does not include crops, food yields, and other components in the agriculture sector which are vital to Kenya’s economy. Putting this limitation aside, the damages to buildings and infrastructure result in only limited impacts to the country’s real GDP growth, with no scenario resulting more than -0.4% in decline. The growth decline ranges from -0.04% for an AAL and between -0.1 to -0.4% for PML flood scenarios, while earthquake events decrease growth by -0.02 for AAL and between -0.03 and -0.3% for PML scenarios. The main sources of damages come from commercial and industrial buildings and critical infrastructure including the power (floods) and telecommunication (earthquakes) sectors.
Chance of a disaster exceeding public financing capacity (Fiscal gap)
Results show that the modelled disaster scenarios have limited impacts on Kenya’s public debt. The PML scenarios are expected to increase the debt ratio only marginally, from 66.4% of GDP to between 66.5% and 66.7% for floods, and from 66.4% of GDP to 66.7% for earthquakes. However, the projections also show that debt continues to rise over time after the shock, as public reconstruction costs and existing debt-servicing costs place additional pressure on government finances.
Sovereign debt due to an extreme event
Flood and earthquake have the largest relative scale across the indicators shown, each equivalent to around 0.6% of Kenya’s 2025 GDP. Relative to public finances, flood PML is equivalent to 3.5% of annual government revenue, 2.6% of annual public expenditure and 0.9% of gross public debt, while earthquake PML is equivalent to 3.2% of revenue, 2.3% of expenditure and 0.8% of gross public debt. Landslide and tsunami PMLs are lower across the indicators shown.
These figures suggest that the modelled 1-in-100-year losses are relatively limited at the aggregate macro-fiscal level. However, even smaller national-level ratios may still create localised reconstruction needs, budget reallocations or sector-specific pressures, depending on the location and assets affected. The comparison should be read as a scale indicator, not as a direct estimate of how much public debt would increase after the event.
RESILIENCE OPTIONS
4. Current resilience investment
This section draws on information compiled in UNDRR's Finance Observatory. It provides a snap-shot of current investment in risk reduction and resilience building, and the extent of anticipatory and resilience finance available based on publicly available data.
For more information on the criteria and scaling used for these financial indicators, see the methodology for details.
Costed adaptation needs are reported at US$2.39 billion per year, while the costed DRR financing strategy is reported at US$1.26 million per year. Average humanitarian relief expenditure over 2020–2024 was US$250.1 million per year, equivalent to 15.5% of total ODA. Pre-arranged financing is under development.
5. Potential for loss and volatility reduction
This section draws on a series of country-specific diagnostic studies and policy assessments for the country. Together, they explore the potential to reduce disaster losses and economic volatility, and illustrate how resilience measures can change fiscal, economic, social and environmental outcomes.
Unlike the globally comparable metrics presented earlier in the profile, these studies use different models, assumptions, reference years and data sources, and may incorporate national calibrated information. As we build out the dataset through the Facility in the interim, the data below is based on national data and detail hypothesis.Their results should therefore be interpreted within the scope of each individual study and should not be directly compared with one another or with the global metrics.
For further information on the methodology, assumptions and sources used in each analysis, see the methodology page and the source links beneath each chart.
Disaster losses to assets and consumption
The welfare results translate asset losses into their impacts on households. The chart compares asset risk and well-being risk under current conditions and under a modelled resilience scenario. While expected asset losses decline only modestly, from 0.22% to 0.19% of GDP (around 14%), well-being risk falls more substantially, from 0.47% to 0.29% of GDP (around 38%). This illustrates that strengthening socioeconomic resilience has a much greater effect on reducing the welfare consequences of disasters than on reducing direct physical asset losses.
Household consumption resilience after a severe shock
Kenya’s current household consumption resilience – the economy’s capacity to absorb asset losses before they translate into welfare losses – stands at just 46 per cent. With resilience investment, household consumption resilience rises to 68 per cent, a 22-percentage-point improvement.
Estimated cost, benefits and investment needs: agriculture and resilience (2031–2050)
The study estimates that the projected benefits of resilient, low-carbon agriculture are almost six times larger than the investment amount assessed, and around fifteen times higher than the estimated economic cost.
Estimated cost, benefits and investment needs: Forest landscapes (2031–2050)
The low-carbon and resilient climate scenario has higher estimated costs and investment needs than the business-as-usual scenario, but also higher estimated benefits. In the low-carbon and resilient climate scenario, combined benefits from timber revenue and reduced externalities are estimated at around US$9.38 billion, compared with combined investment needs and economic costs of around US$5.32 billion. Under business as usual, combined benefits are estimated at around US$461 million, compared with combined investment needs and economic costs of around US$244 million. Results should be interpreted within the scope and assumptions of the underlying study.
Links to the National Government DRR analysis
Kenya is building out a new risk platform that is not yet publicly available. Information on government risk reduction efforts is available through government websites.
Disclamer
The results presented are based on probabilistic risk modelling and forward-looking climate and economic projections. Average Annual Loss (AAL) and Probable Maximum Loss (PML) estimates reflect expected losses over long time horizons rather than specific events or years. As with all model-based analyses, results depend on assumptions related to hazard frequency and intensity, exposure, vulnerability, and future socioeconomic pathways.These findings should be interpreted as indicative of relative risk patterns and potential magnitudes, rather than precise forecasts. Methodologies to expand coverage of hazards such as droughts, heatwaves and wildfires are currently under development.