
Sendai Framework Monitor data and analytics
Reported snapshot of and progress against the seven targets of the Sendai Framework, by target, by country and by region.
Global picture
Reporting status (as of April 2026)
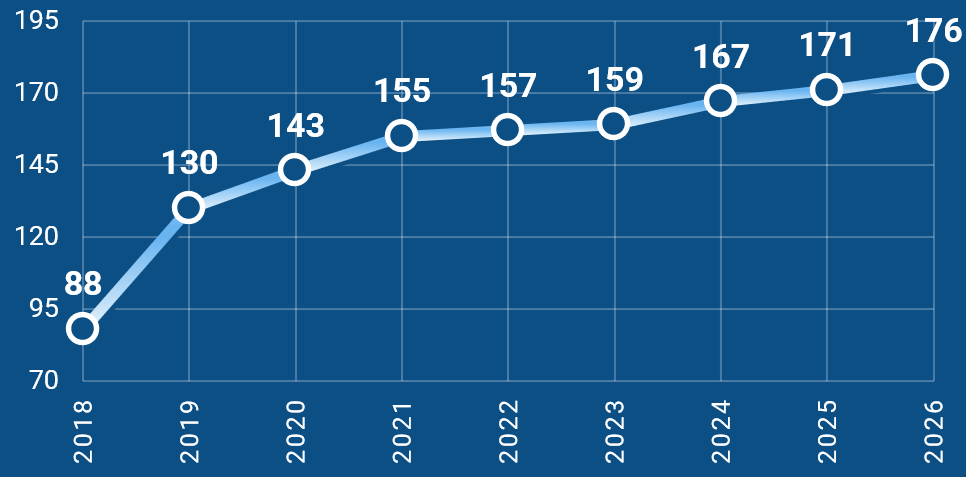
- 176 countries reported on the global targets through the Sendai Framework Monitor by October 2025.
- 87 countries have reported on all seven targets.
- 118 countries have reported on all SDG-related targets (A-E).
- 84 countries reporting sex-, age- & disability-disaggregated data
Target A: Disaster-related deaths and missing persons (excluding COVID-19)
- Improvements have been reported in reducing disaster mortality per 100,000 population.
- Average disaster-related mortality per 100,000 population declined by 65%, from 2.12 in the period 2005-2014 to 0.75 in 2016-2025.
- Despite this decline, the human toll remains substantial, with disasters claiming an average of 37,900 lives each year over the past decade.
Target B: Disaster-affected population (excluding COVID-19)
- In contrast, the number of people affected by disasters has increased significantly
- Globally, the number of disaster-affected people rose from 1,227 per 100,000 population during 2005-2014 to 2,449 during 2016-2025, representing a 100% increase.
- In absolute terms, an average of 100 million people were affected annually during the last decade
Target C: Disaster-related economic losses
- Disasters continue to impose substantial economic costs.
- Total direct economic loss worldwide has been reported to exceed US$ 1 trillion between 2016 and 2025, equivalent to more than 0.3 per cent of the combined gross domestic product (GDP) of reporting countries.
Target D: Disaster damage to critical infrastructure and disruption of basic services
- Damage to critical infrastructure and disruption of basic services remains high.
- Between 2016 and 2025, countries reported 92,947 damaged or destroyed infrastructure units and facilities and more than 1.6 million disruptions to basic services, including essential health and education services.
Target E: National and local disaster risk reduction (DRR) strategies
- Progress continues in strengthening disaster risk reduction governance.
- The number of countries reporting national disaster risk reduction strategies increased from 56 in 2015 to 151 in 2026.
- In addition, 121 countries reported on the implementation of local disaster risk reduction strategies, with an average of 72% of local governments having such strategies in place.
Target F: International cooperation for disaster risk reduction
- International cooperation and financing for disaster risk reduction remains limited relative to growing needs.
- Reporting countries recorded less than 1 billion USD in financial flows in 2025. Between 2015 and 2025, countries also reported approximately 2,000 programmes and initiatives supporting science, technology and innovation transfer, around 1,600 initiatives to strengthen disaster risk reduction statistics, and more than 34,000 instances of capacity development.
Target G: Multi-hazard early warning systems (MHEWS)
- Progress on multi-hazard early warning systems continues steadily.
- As of 2026, a total of 128 countries have reported having multi-hazard early warning systems in place, compared with 55 in 2015.
- However, 62 countries assessed the effectiveness of their systems as limited to moderate, indicating significant gaps in coverage and accessibility
Cite this
United Nations Office for Disaster Risk Reduction (UNDRR). (2026). Sendai Framework Monitor — Data and Analytics. https://www.undrr.org/SFM
Explore the Sendai Framework Monitor
Start here: what the Sendai Framework Monitor is and how to get around.
You are here
Explore the data
Global, regional and country views of reported progress against the seven global targets.
What the 38 indicators measure, and how the framework connects to the SDGs and the Global Goal on Adaptation.
Training resources on the Sendai Framework Monitor (free eLearning course & YouTube Tutorial videos).
Step-by-step guidance for national focal points reporting against the seven global targets.