Ambient (Outdoor) Air Pollution
Ambient (outdoor) air pollution is pollution that is present at concentrations that affect human health, ecosystems and agriculture. It is primarily measured through the presence of particulate matter (PM10 and PM2.5), ozone, nitrogen dioxide, sulphur dioxide and carbon monoxide in the air. Ambient air pollution is one of the leading environmental risk factors affecting urban and rural populations around the world, resulting in an estimated 4.2 million premature deaths in 2019 (WHO, 2024).
Primary reference(s)
WHO, 2024. Development Goal indicator 3.9.1: mortality attributed to air pollution. Geneva, World Health Organization, 2024. (Accessed 21 January 2025).
Annotations
Additional scientific description
Ambient (outdoor) air pollution is a major cause of death and disease globally. Long-term exposure (over years or lifetimes) reduces life expectancy, mainly due to cardiovascular and respiratory diseases and lung cancer. Short-term exposure (over hours or days) can also cause a range of health impacts, including effects on lung function, exacerbation of asthma, increases in respiratory and cardiovascular hospital admissions and mortality. Emerging evidence suggests links to dementia and cognitive decline, and effects on early life such as low birth weight (Kilian et al., 2018; Niu et al., 2022).
Ambient air pollution contains a range of pollutants from both natural (e.g. soil dust, salt spray, wildfire smoke) and man-made sources (e.g. energy, transport, industry, agriculture, inefficient combustion of fuels). Pollutants of major concern include PM, O3, NO2 and SO2 (WHO, 2020).
'Particulate matter' refers to a mixture of solid and liquid particles of varying size, shape and composition. Some particles are primary (emitted directly), others are secondary (formed through chemical reactions). Size and duration of exposure determine health risks. PM2.5 poses the greatest risk, penetrating deep into lungs and potentially entering the bloodstream (WHO, 2024a; PHE, 2019).
The effects of PM on health occur at levels of exposure currently being experienced by many people both in urban and rural areas and in developed and developing countries - although exposures in many fast-developing cities today are often far higher than in developed cities of comparable size. Reducing annual average fine particulate matter (PM2.5) concentrations from current levels to the WHO guideline level of 5 μg/m3, could reduce air pollution-related deaths by around 70%. However, even in the European Union, where PM concentrations in many cities do comply with guideline levels, it is estimated that average life expectancy is 8.6 months lower than it would otherwise be, due to PM exposures from human sources.
There are serious risks to health not only from exposure to PM, but also from exposure to O3, NO2 and SO2. As with PM, concentrations are often highest largely in the urban areas of low- and middle-income countries.
Ozone at ground level - not to be confused with the ozone layer in the upper atmosphere - is one of the major constituents of photochemical smog. It is formed by the reaction with sunlight (photochemical reaction) of pollutants such as nitrogen oxides (NOx) from vehicle and industry emissions and volatile organic compounds (VOCs) emitted by vehicles, solvents and industry. As a result, the highest levels of O3 pollution occur during periods of sunny weather. Excessive O3 in the air can have a marked effect on human health. It can cause breathing problems, trigger asthma, reduce lung function and cause lung diseases.
As an air pollutant, NO2 has several related impacts. Under short-term exposure to concentrations exceeding 200 μg/m3, it is a toxic gas which causes significant inflammation of the airways. NO2 is the main source of nitrate aerosols, which form an important fraction of PM2.5 and, in the presence of ultraviolet light, of O3. The major sources of anthropogenic emissions of NO2 are combustion processes (heating, power generation, engines in vehicles and ships). Epidemiological studies have shown that symptoms of bronchitis in asthmatic children increase in association with long-term exposure to NO2. Reduced lung function growth is also linked to NO2 at concentrations currently measured (or observed) in cities of Europe and North America.
SO2 is a colourless gas with a sharp odour. It is produced from the burning of fossil fuels (coal and oil) and the smelting of mineral ores that contain sulphur. The main anthropogenic source of SO2 is the burning of sulphur-containing fossil fuels for domestic heating, power generation and motor vehicles. SO2 can affect the respiratory system and lung function and can cause irritation of the eyes. Inflammation of the respiratory tract causes coughing, mucus secretion, aggravation of asthma and chronic bronchitis and makes people more prone to infections of the respiratory tract. Hospital admissions for cardiac disease and mortality, increase on days with higher SO2 levels. When SO2 combines with water, it forms sulphuric acid; this is the main component of acid rain which is a cause of deforestation.
Although air pollution can be harmful to everyone, some people are more affected because they live in a polluted area, are exposed to higher levels of air pollution in their daily lives or are more susceptible to health problems caused by air pollution. The most vulnerable face all of these disadvantages. Groups more affected by air pollution include older people, children, individuals with pre-existing cardiovascular or respiratory disease, pregnant women, communities in areas of higher air pollution and low-income communities (PHE, 2018).
It is also important to note that at present, there is no clear evidence of a safe level of exposure to air pollutants below which there is no risk of adverse health effects. Therefore, further reductions of concentrations of air pollutants below air quality standards are likely to bring additional health benefits. Actions that improve air pollution can also offer wider public health and wellbeing co-benefits.
Metrics and numeric limits
| Pollutant | Averaging time | Interim target | AQG level | |||
|---|---|---|---|---|---|---|
| 1 | 2 | 3 | 4 | |||
| PM2.5, µg/m³ | Annual | 35 | 25 | 15 | 10 | 5 |
| 24-houra | 75 | 50 | 37.5 | 25 | 15 | |
| PM10, µg/m³ | Annual | 70 | 50 | 30 | 20 | 15 |
| 24-houra | 150 | 100 | 75 | 50 | 45 | |
| O3, µg/m³ | Peak seasonb | 100 | 70 | – | – | 60 |
| 8-houra | 160 | 120 | – | – | 100 | |
| NO2, µg/m³ | Annual | 40 | 30 | 20 | – | 10 |
| 24-houra | 120 | 50 | – | – | 25 | |
| SO2, µg/m³ | 24-houra | 125 | 50 | – | – | 40 |
| CO, mg/m³ | 24-houra | 7 | – | – | – | 4 |
a 99th percentile (i.e. 3–4 exceedance days per year).
b Average of daily maximum 8-hour mean O3 concentration in the six consecutive months with the highest six-month running-average O3 concentration.
The WHO Air Quality guidelines (WHO, 2021) offer recommended exposure levels for particulate matter (PM10 and PM2.5), O3, NO2, SO2 and CO, as well as a set of interim targets to encourage a progressive improvement in air quality, as outlined in Table 1 (WHO, 2021).
Key relevant UN convention / multilateral treaty
In 1979, the UNECE Convention on Long-range Transboundary Air Pollution, was signed in 1979 to deal with air pollution on a broad regional basis. The Convention entered into force in 1983, laying down the general principles of international cooperation for air pollution abatement and setting up an institutional framework which has since brought together research and policy.
WHO International Health Regulations (WHO, 2016).
Drivers
The primary drivers of ambient air pollution are diverse and often interlinked, encompassing both anthropogenic and natural sources. Industrial activities, particularly those involving the combustion of fossil fuels, are significant contributors. Power plants, manufacturing facilities and oil refineries release substantial quantities of pollutants such as SO₂, NOₓ, PM and volatile organic compounds (VOCs) into the atmosphere (Kibble et al., 2005).
Transportation is another critical driver, with vehicles emitting a range of pollutants including CO, NOₓ, PM and VOCs. The rapid urbanisation and economic growth witnessed in many low- and middle-income countries have led to increased vehicle ownership and congested traffic conditions, thereby amplifying urban air pollution levels. Additionally, the use of diesel engines, prevalent in freight and public transport, contributes significantly to fine particulate and black carbon emissions, which have profound health and climate implications (Colvile et al., 2001).
Agricultural practices also play a role. The burning of crop residues, commonly practised in several parts of the world to clear fields for planting, releases large amounts of PM and greenhouse gases. The use of fertilisers contributes to ammonia emissions, which can react in the atmosphere to form secondary particulate matter (Abdurrahman et al., 2020).
Natural sources, though often overlooked, contribute to background air pollution. Dust storms, wildfires and volcanic activity release substantial quantities of particulates and gases. However, the frequency and intensity of wildfires are increasingly influenced by human-induced climate change, creating a complex interplay between natural and anthropogenic drivers (Paul et al., 2023; Stewart, 2022; Aghababaeian, 2021).
Climatic factors such as temperature inversions-where a layer of warm air traps pollutants close to the ground-can lead to prolonged periods of high pollution levels (Trinh et al., 2019). This is compounded by increasing wildfire frequency and intensity, which release massive amounts of fine particulate matter and toxic gases, affecting air quality across vast regions (Paul et al., 2023).
Urbanization and rapid industrialisation remain primary contributors to ambient air pollution. Pollutants originate from vehicular emissions, industrial processes, construction activities and the burning of fossil fuels (Kibble et al., 2005; Colvile et al., 2001). Urban heat islands-where elevated temperatures enhance ground-level ozone formation-exacerbate this pollution (Ulpiani, 2021).
Impacts
Ambient air pollution has wide-ranging impacts on human health, ecosystems and economies. Health-wise, exposure is linked to outcomes ranging from acute respiratory infections to chronic conditions such as asthma, cardiovascular disease and lung cancer. The World Health Organization estimates that ambient air pollution caused approximately 4.2 million premature deaths in 2019 (WHO, 2024b). Children, the elderly and individuals with pre-existing conditions are particularly vulnerable. Prenatal and early-life exposures have been associated with impaired lung development, reduced cognitive function and increased risk of chronic disease later in life (Kilian et al., 2018; Niu et al., 2022; Manisalidis, 2020).
Environmental impacts include ecosystem degradation through processes like acidification and eutrophication. Atmospheric deposition of nitrogen oxides (NOₓ) from fossil fuel combustion contributes to nutrient enrichment in water bodies (Zhang et al., 2021). Ozone, a secondary pollutant formed through photochemical reactions involving NOₓ and VOCs, damages crops and forests, leading to reduced yields and biodiversity loss (Emberson, 2020). Black carbon and methane are potent climate forcers, contributing to global warming (Ramanathan and Feng, 2009).
Economically, air pollution imposes significant burdens. Health-related costs—such as medical expenses and lost productivity—are substantial (Dechezleprêtre et al., 2019). Reduced crop yields affect food security, particularly in agrarian economies (Emberson, 2020). Pollution also deters tourism, degrades cultural heritage and increases urban cleaning and maintenance costs (Dechezleprêtre et al., 2019).
Multi-hazard context
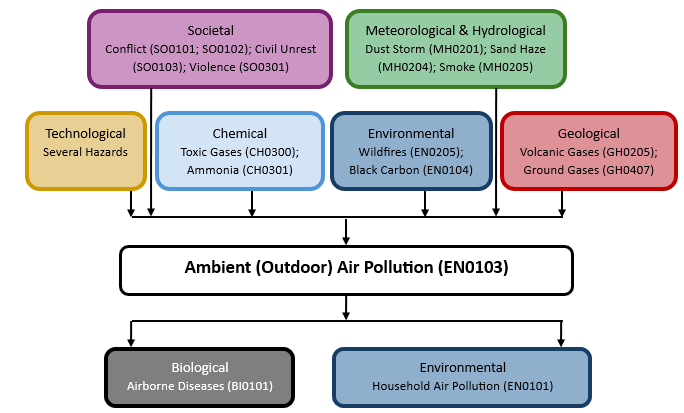
The figure below summarises common interactions between ambient (outdoor) air pollution and other hazards. This information should be used with caution and not be solely relied upon in disaster risk management, particularly as some interactions may not have been included. Note that hazardous events occurring together or locally in space or time may not necessarily cause, amplify or be otherwise related to each other. Specific examples of multi-hazard context can be found in the ‘Hazard drivers’ and ‘Impacts’ sections above.
Multi-hazard diagram
Risk Management
Most sources of outdoor air pollution are beyond the control of individuals. Effective management requires coordinated action at local, national and regional levels by policymakers in sectors such as transport, energy, waste management, urban planning and agriculture (WHO, 2024a). Successful examples include:
- Industry: Clean technologies to reduce smokestack emissions; improved waste management, including methane capture from landfills to produce biogas.
- Energy: Access to affordable, clean household energy for cooking, heating and lighting.
- Transport: Shifting to clean energy for power generation; prioritising urban public transport, walking and cycling networks; transitioning to low-emission and low-sulphur fuels and vehicles.
- Urban planning: Enhancing building energy efficiency and developing greener, more compact cities.
- Power generation: Increased use of low-emission fuels and renewable, combustion-free energy (solar, wind, hydropower); co-generation and distributed energy generation (e.g. mini-grids, rooftop solar).
- Waste management: Waste reduction, separation, recycling, reuse and biological processing (e.g. anaerobic digestion to produce biogas). Where incineration is necessary, emission-controlled combustion technologies are essential.
Once an impending air quality deterioration is detected, the early warning system triggers alerts that are disseminated through various channels, including mobile apps, social media and traditional media outlets. These alerts are tailored to different audiences, providing specific recommendations for vulnerable groups, such as children, the elderly and individuals with pre-existing respiratory conditions. Public health advisories might include suggestions to reduce outdoor activities, close windows or use air purifiers. Moreover, the early warning system can guide policy responses, such as temporary traffic restrictions or industrial emissions controls, to mitigate the severity of pollution events (Kelly et al., 2011).
- Municipal and agricultural waste management: strategies for waste reduction, waste separation, recycling and reuse or waste reprocessing; as well as improved methods of biological waste management such as anaerobic waste digestion to produce biogas, are feasible, low-cost alternatives to the open incineration of solid waste. Where incineration is unavoidable, then combustion technologies with strict emission controls are critical.
Monitoring
The section and the table below provide an overview of monitoring for ambient (outdoor) air pollution. This information can be used for forecasting within a national early warning system (EWS). Since EWS capacities and processes differ across countries, the most current and specific information should be obtained from the appropriate national or regional agency or authority responsible for disaster management.
| Which institution(s) produce(s) disaster risk data/information? | Environmental agencies; health agencies |
| How is the hazard observed/monitored/forecast? | Country-specific networks of air quality monitoring stations are strategically placed in urban and industrial areas. These stations continuously measure concentrations of pollutants including PM₂.₅, PM₁₀, NO₂, SO₂, O₃ and CO. Data from these sensors are transmitted in real time to central databases for analysis (Kelly et al., 2011). Satellite monitoring complements ground-based stations. |
References
Abdurrahman, M. I., Chaki, S., & Saini, G., 2020. Stubble burning: Effects on health & environment, regulations and management practices. Environmental Advances, 2, 100011. DOI: 10.1016/j.envadv.2020.100011. Accessed 21 January 2025.
Aghababaeian, H., Ostadtaghizadeh, A., Ardalan, A., Asgary, A., Akbary, M., Yekaninejad, M. S., & Stephens, C., 2021. Global health impacts of dust storms: a systematic review. Environmental health insights, 15. DOI: 10.1177/11786302211018390. Accessed 21 January 2025.
Colvile, R. N., Hutchinson, E. J., Mindell, J. S., & Warren, R. F., 2001. The transport sector as a source of air pollution. Atmospheric environment, 35(9), 1537-1565. Accessed 21 January 2025.
Dechezleprêtre, A., N. Rivers and B. Stadler, 2019. "The economic cost of air pollution: Evidence from Europe", OECD Economics Department Working Papers, No. 1584, OECD Publishing, Paris. DOI: 10.1787/56119490-en. Accessed 21 January 2025.
Emberson, L., 2020. Effects of ozone on agriculture, forests and grasslands. Philosophical Transactions of the Royal Society A, 378(2183), 20190327. DOI: 10.1098/rsta.2019.0327. Accessed 21 January 2025.
Kelly, F. J., Fuller, G. W., Walton, H. A., & Fussell, J. C., 2012. Monitoring air pollution: Use of early warning systems for public health. Respirology, 17(1), 7-19. DOI: 10.1111/j.1440-1843.2011.02065.x. Accessed 21 January 2025.
Kibble A, Harrison R, Point sources of air pollution, Occupational Medicine, Volume 55, Issue 6, September 2005. Pages 425–431. DOI: 10.1093/occmed/kqi138. Accessed 21 January 2025.
Kilian J, Kitazawa M. The emerging risk of exposure to air pollution on cognitive decline and Alzheimer's disease - Evidence from epidemiological and animal studies. Biomed J. 2018 Jun;41(3):141-162. https://doi.org/10.1016/j.bj.2018.06.001.
Manisalidis, I., Stavropoulou, E., Stavropoulos, A., & Bezirtzoglou, E., 2020. Environmental and health impacts of air pollution: a review. Frontiers in public health, 8, 14. DOI: 10.3389/fpubh.2020.00014. Accessed 21 January 2025.
Niu Z, Habre R, Chavez TA, Yang T, Grubbs BH, Eckel SP, Berhane K, Toledo-Corral CM, Johnston J, Dunton GF, Lerner D, Al-Marayati L, Lurmann F, Pavlovic N, Farzan SF, Bastain TM, Breton CV. Association Between Ambient Air Pollution and Birth Weight by Maternal Individual- and Neighborhood-Level Stressors. JAMA Netw Open. 2022 Oct 3;5(10):e2238174. DOI: 10.1001/jamanetworkopen.2022.38174.
Paul, M. J., LeDuc, S. D., Boaggio, K., Herrick, J. D., Kaylor, S. D., Lassiter, M. G., ... & Rice, R. B., 2023. Effects of air pollutants from wildfires on downwind ecosystems: Observations, knowledge gaps, and questions for assessing risk. Environmental Science & Technology, 57(40), 14787-14796. DOI: 10.1021/acs.est.2c09061. Accessed 21 January 2025.
Paerl, H. W.,1995. Coastal eutrophication in relation to atmospheric nitrogen deposition: Current perspectives. Ophelia, 41(1), 237–259. DOI: 10.1080/00785236.1995.10422046. Accessed 21 January 2025.
PHE, 2018. Health matters: air pollution Guidance from UK Gov. Public Health England (PHE). Accessed 21 January 2025.
PHE, 2019. Review of interventions to improve outdoor air quality and public health. Public Health England (PHE). Accessed 21 January 2025.
Ramanathan, V., & Feng, Y., 2009. Air pollution, greenhouse gases and climate change: Global and regional perspectives. Atmospheric environment, 43(1), 37-50. DOI: 10.1016/j.atmosenv.2008.09.063. Accessed 21 January 2025.
Stewart, C., Damby, D.E., Horwell, C.J. et al. Volcanic air pollution and human health: recent advances and future directions. Bull Volcanol 84, 11, 2022. Accessed 21 January 2025.
Trinh, T.T., Trinh, T.T., Le, T.T. et al. Temperature inversion and air pollution relationship, and its effects on human health in Hanoi City, Vietnam. Environ Geochem Health 41, 929–937, 2019. DOI: 10.1007/s10653-018-0190-0. Accessed 21 January 2025.
Ulpiani, G., 2021. On the linkage between urban heat island and urban pollution island: Three-decade literature review towards a conceptual framework. Science of the total environment, 751, 141727. DOI: 10.1016/j.scitotenv.2020.141727. Accessed 21 January 2025.
UNEP, no date. Frequently Asked Questions on Air Pollution. International Day for Clean Air for blue skies, United Nations Environment Programme (UNEP). Accessed 21 January 2025.
WHO, 2016. International Health Regulations (2005), 3rd ed. World Health Organization (WHO). Accessed 21 January 2025.
WHO, 2021. WHO global air quality guidelines: particulate matter (PM2.5 and PM10), ozone, nitrogen dioxide, sulfur dioxide and carbon monoxide. WHO global air quality guidelines: particulate matter (PM2.5 and PM10), ozone, nitrogen dioxide, sulfur dioxide and carbon monoxide. Accessed 21 January 2025.
WHO, 2023. WHO Fact Sheet - Ambient (outdoor) air pollution. Geneva. Ambient (outdoor) air pollution. Accessed 21 January 2025.
Zhang, Q, Li, Y., Wang, M., Wang, K., Meng, F., Liu, L., Zhao, Y., Ma, L., Zhu, Q., Xu, W., Zhang, F., 2021. Atmospheric nitrogen deposition: A review of quantification methods and its spatial pattern derived from the global monitoring networks. Ecotoxicology and Environmental Safety, 216, 112180. Accessed 21 January 2025.